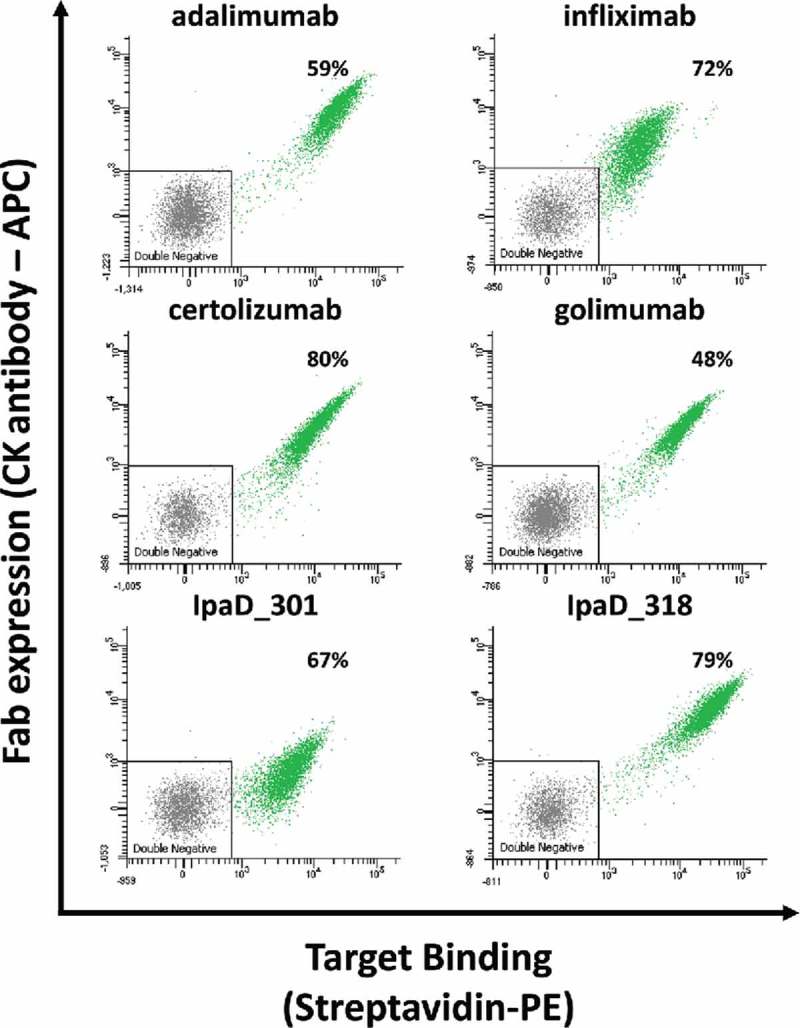
Figure 5.

Representative bivariate flow cytometric analysis of yeast cells expressing Fab antibody fragments expressed on their surface. Each single dot on the plot designates the APC (y-axis) and PE (x-axis) fluorescence intensity values for a single yeast cell. Cells were double-labeled with biotinylated antigen/Streptavidin–PE (target binding) and anti-CK APC labels (Fab expression). Antigen concentrations in labeling experiments were 20 nM for anti-TNF antibodies and 50 nM for anti-IpaD antibodies. Functional subpopulations were gated using an inverted gate of the double negative sub-populations. The percentage number correspond to the mean percentage of cells expressing functional Fabs from three separate inductions.
