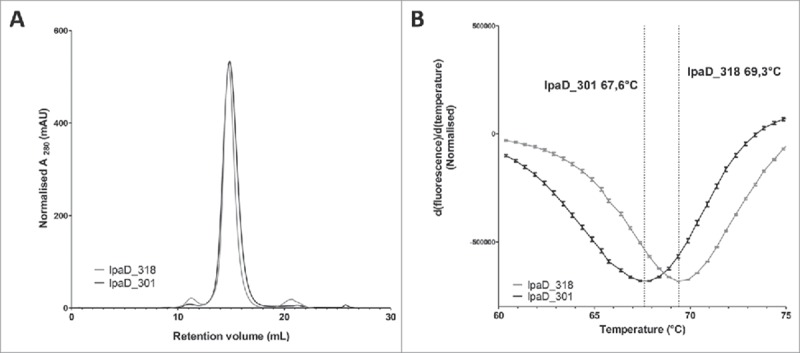
Figure 6.

Biophysical characterization of IpaD_301 IgG and IpaD_318 IgG expressed by HEK cells. (A): Size-exclusion chromatograms of the protein A purified IgGs on a Superdex 200 10/300 GL size-exclusion column for IpaD_301 IgG (black) and IpaD_318 IgG (grey). Monomeric IgG species elutes at 15 mL and aggregates or multimeric species elutes between 10 to 12 mL. (B): Tm determination of IgGs by differential scanning fluorimetry. The fluorescence intensities are normalized to peak values. Error bars correspond to experiment triplicates.
