
Figure 2.
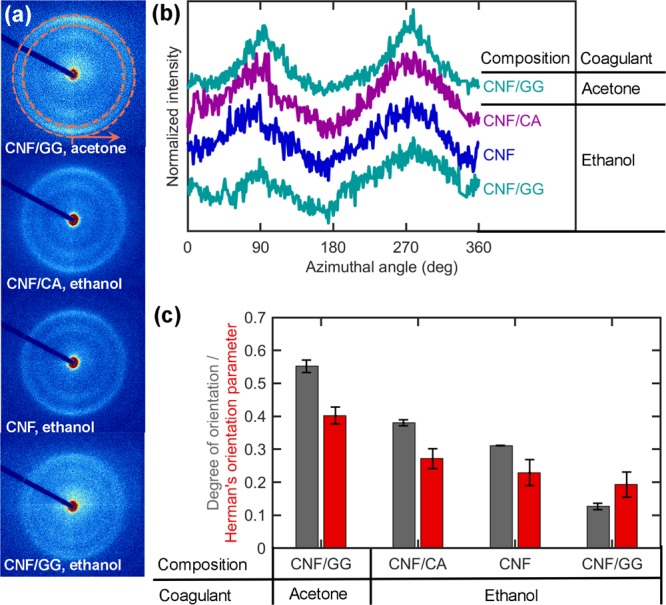
(a) 2D-WAXD diffractograms of filaments positioned horizontally. (b) Azimuthal intensity distributions of various filament samples. Orange circles in the first diffractogram in (a) indicate the position of the cellulose 200 peak and the tick and arrow the starting point and direction of the azimuthal integrations shown in (b). (c) Orientation indices (eq 2) and Herman’s orientation parameters (eq 4) of the samples calculated based on the azimuthal intensity distributions shown in (b). The error bars indicate the standard error among the parameters calculated with different peaks or values of φ0; that is, different sections in the azimuthal plot (b). Note that CNF/CA and CNF are the same filament before (CNF/CA) and after (CNF) the removal of the CA shell.