
Figure 4.
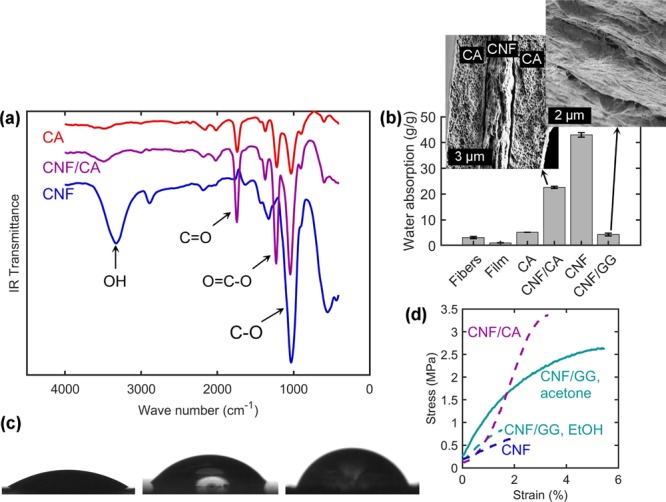
(a) FTIR spectra of CNF filaments with and without CA shell as well as a neat CA filament. (b) Water absorption capacities of core/shell filaments along with reference cellulosic materials. Error bars are based on standard deviation divided by the square root of the sample size (mostly two specimens, see Experimental Section). Insets show the SEM images (high magnification) of the cross-sectional CNF/CA and CNF/GG (only the core shown in the latter case). (c) Photographs of water drops on films cast from CNF (left), CA (middle), and GG (right). The images of CNF and CA are acquired immediately and GG 2 s after drop deposition (beginning of linearly progressing decline in Figure S4, Supporting Information). (d) Wet stress–strain curves of the filaments coagulated in ethanol (dashed lines) and acetone (solid line). “CNF” refers to the CNF/CA filament after the removal of CA.