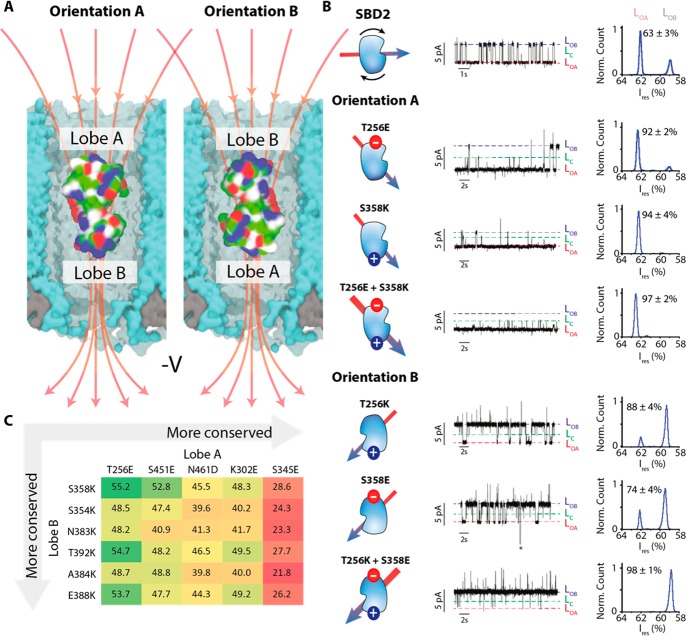
Figure 4.
Tuning the orientation of SBD2 in the ClyA nanopore. (A) SBD2 inside the ClyA nanopore showing two possible orientations. The red arrows indicate the electric field lines upon negative applied voltage. (B) Typical ionic current blockades provoked by the capture of SBD2 and its variants (∼70 nM, cis) by Type I ClyA-AS nanopore at −100 mV. The conformation of SBD2 is shown on the left of the current trace with the arrow indicating the dipole moment of the protein. The latter was calculated using the dipole watcher plugin of VMD.24 The LOA, LOB, and LC current levels are indicated. The histograms show the distribution of LOA and LOB. The additional current spikes observed for SBD2 T256K; S358E and T256K+S358E variants did not depend on the concentration of ligand, suggesting they do not represent an additional conformation of SBD2. The asterisk represents the restoration of the open pore current after SBD2 exited from the pore. (C) Table showing the amino acids in lobe A and lobe B that were considered for substitutions and selected after supercharging and MD simulations. The residues are arranged from the least to the most conserved as indicated by the gray arrows. The values indicate the distances in angstrom between the two respective residues.

