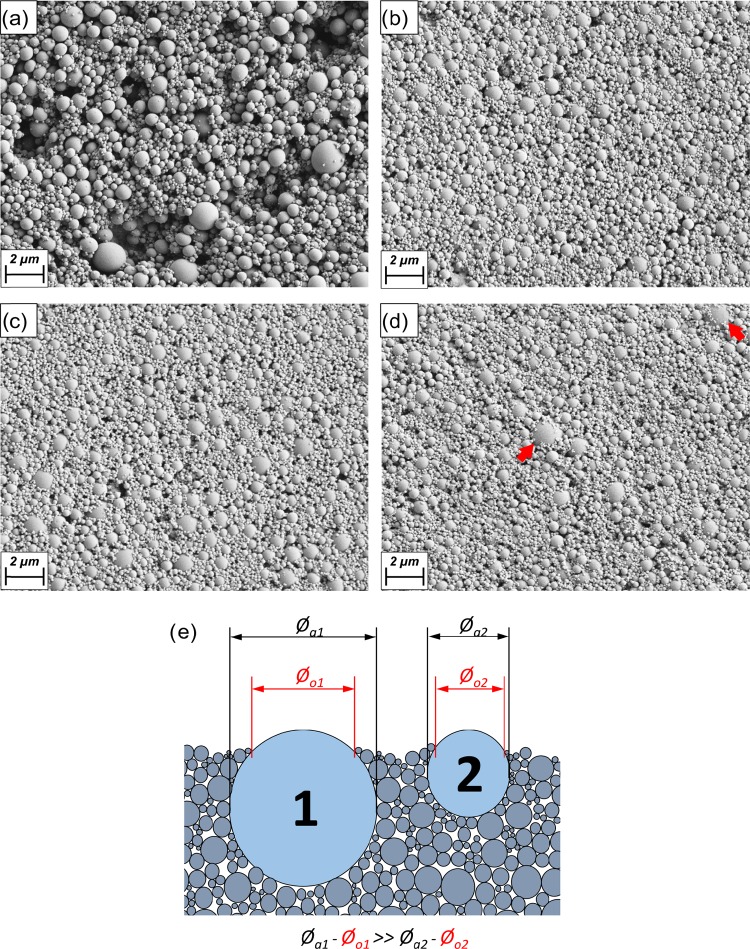
Figure 5.
SEM images of the top surface of coatings dried at different temperatures: 20 °C (a), 50 °C (b), 80 °C (c), and 110 °C (d). The red arrow in (d) indicates the unusual presence of particles of the largest size (>2 μm, normally, settling particles) on the top layer of the coating formed at the fastest drying rate (110 °C). The schematic illustration in (e) highlights the differences in the observed (⌀o) and actual (⌀a) diameters of the large particles that assemble atop the coating.

