
Figure 3. Temporal plots for percent change in 23Na concentration.
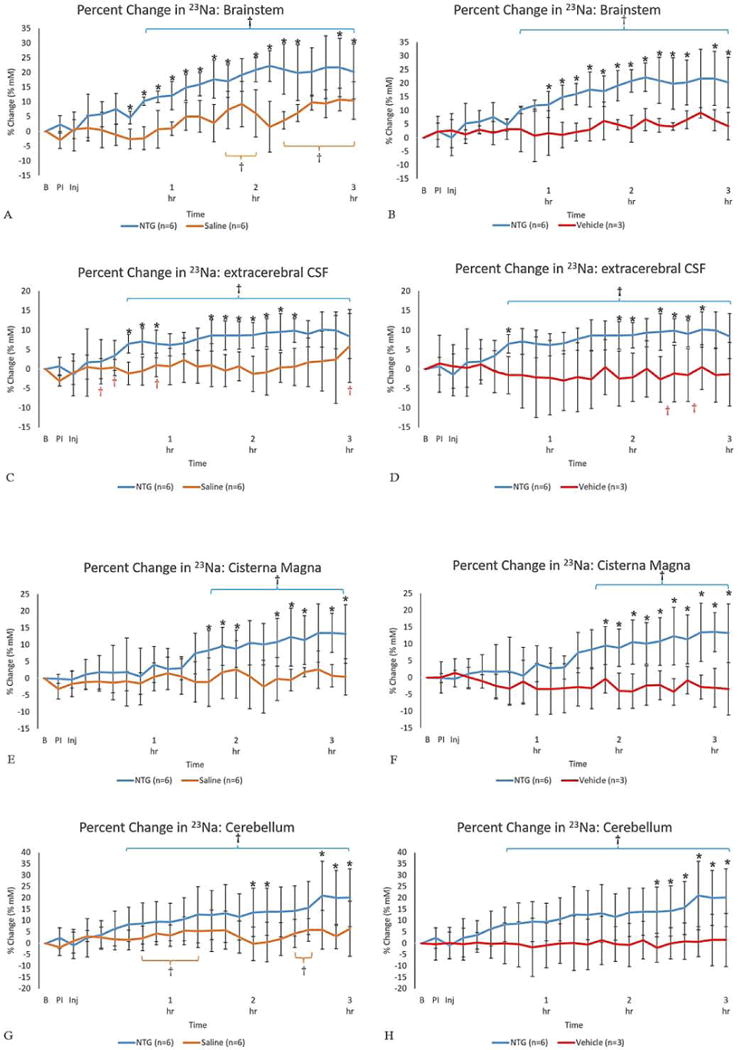
Percent change in 23Na concentration (% change ± SD) for (A-B) brainstem, (C-D) extracerebral CSF, (E-F) cisterna magna and (G-H) cerebellum as a function of time after injection. Signals were normalized to a pre-injection average baseline, with t=0 representative of the pre-injection scan acquired just before the IP injection. Utilizing a mixed model ANOVA, statistical significances are *p<0.05 (Tukey’s post-hoc) for comparisons between (left columns) NTG and saline as control & (right columns) NTG and vehicle as an additional control. For temporal comparisons within the individual cohorts’ statistical significances are identified by †p<0.05 (LSD). (Blue error brackets indicate NTG, whereas orange brackets indicate saline.)
Abbreviations: B, Baseline; PI, Pre-Injection; Inj, Injection point; IP, intraperitoneal; SD, Standard Deviation.