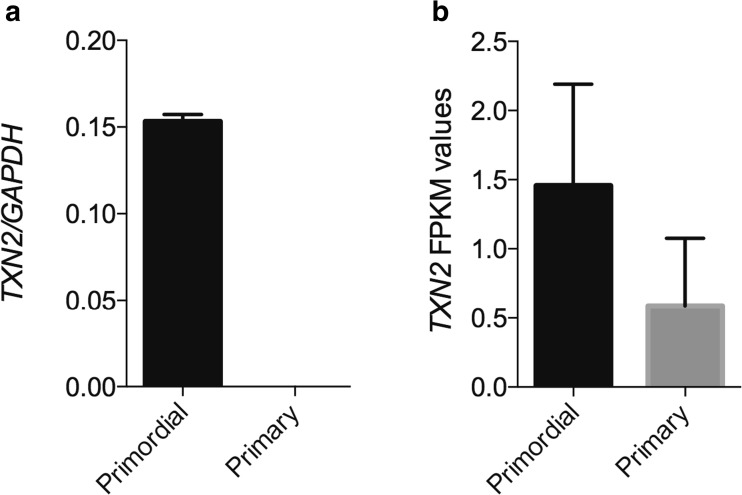
Fig. 2.
TXN2 transcript analysis by RT-qPCR compared to RNA seq. data. Real-time quantitative PCR of a TXN2 RNA in primordial and primary follicles, respectively, relative to the reference gene GAPDH (p < 0.200, unpaired t test with Welch correlation) compared to the b TXN2 expression from RNA seq. data (FPKM values).

