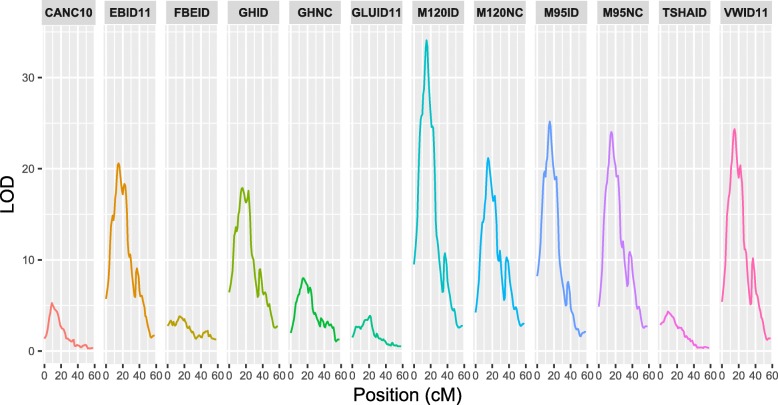
Fig. 2.
LOD score distribution of QTLs for traits at the maturity locus region on chromosome 5. Each panel in the figure represents a different trait. LOD threshold 95% confidence intervals are listed in Table 3. CA, citric acid 2010; EB, early blight; FBE, bud-end fry color Idaho; GH, growth habit; GLU, glucose; M95, vine maturity at 95DAP; M120, vine maturity at 120DAP; TSHA, tuber shape; VW, Verticillium wilt; ID, Idaho; NC, North Carolina; DAP, days after planting; numbers 10 and 11 in the trait names indicate years 2010 and 2011, respectively

