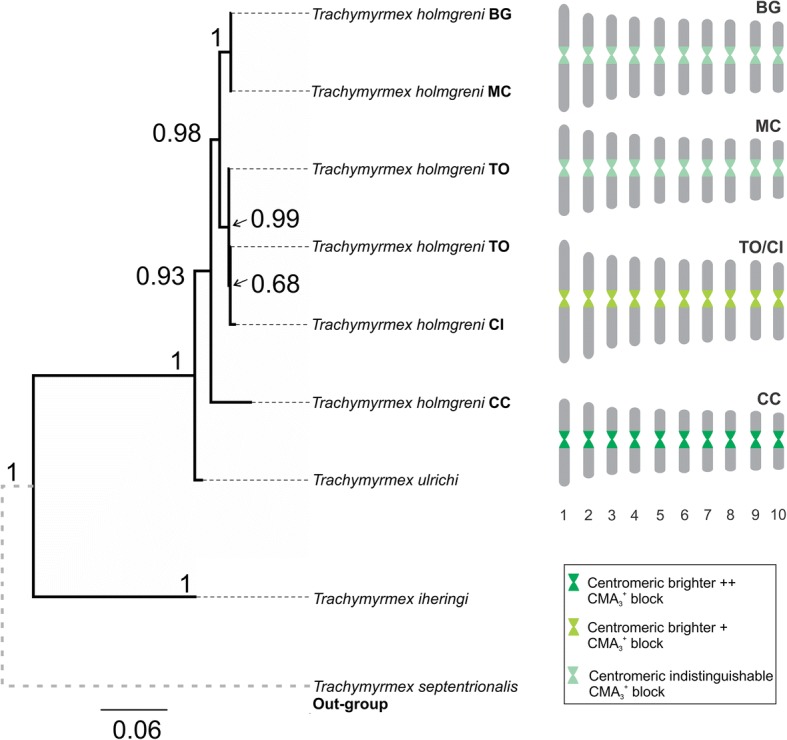
Fig. 3.

Phylogenetic relationships among T. holmgreni populations and ideograms depicting the CMA3 patterns of chromosomes. Phylogenetic tree obtained by a Bayesian analysis of mtDNA sequences of COI-tRNAleu-COII of T. holmgreni and outgroups (Trachymyrmex spp.). The numbers at the nodes indicate the posterior probabilities (PP) from the Bayesian analysis. For each population, an ideogram based on karyomorphometric data, indicates the different brightness observed after fluorochrome staining
