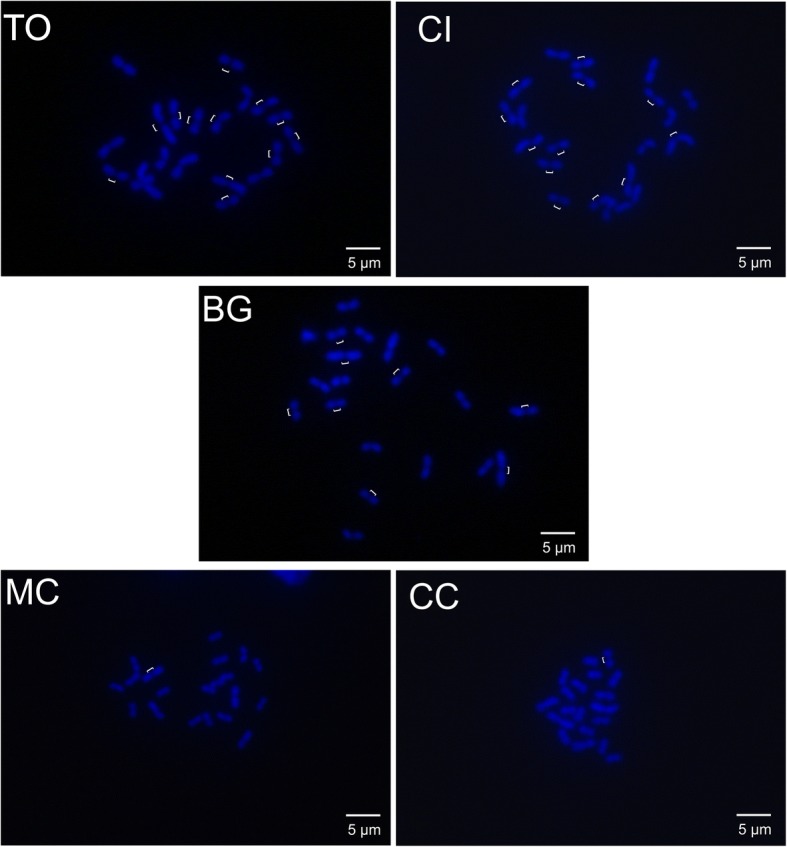
Fig. 4.

Centromere variation in Trachymyrmex holmgreni populations. The centromere was revealed by staining the metaphases with DAPI only. The white bars indicate the distinctly longer centromeres in the populations CI, TO, and BG and for comparison the shorter centromeres in one chromosome each in MC and CC
