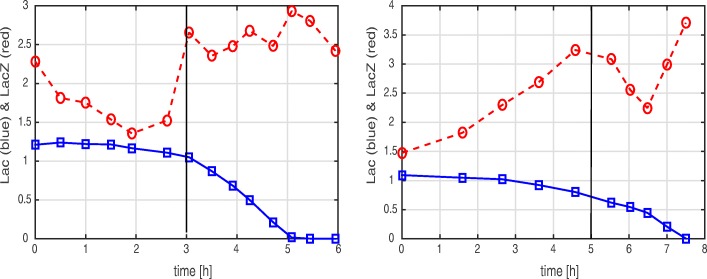
Fig. 13.
Time-course of lactose concentration (blue, solid line) and LacZ activity as proxy for the LacZ concentration (red, dashed line) for two experimental conditions. Left: a preculture in minimal medium with lactose is followed by a main culture in minimal medium with glucose. The dark vertical line indicates the timing of the depletion of glucose. Right: a glucose pulse experiment during exponential growth on minimal medium with lactose. The dark vertical line indicates the timing of the pulse. Data are taken from [14] (there: Supplementary file 2, Figures 6 (left) and 10 (right))

