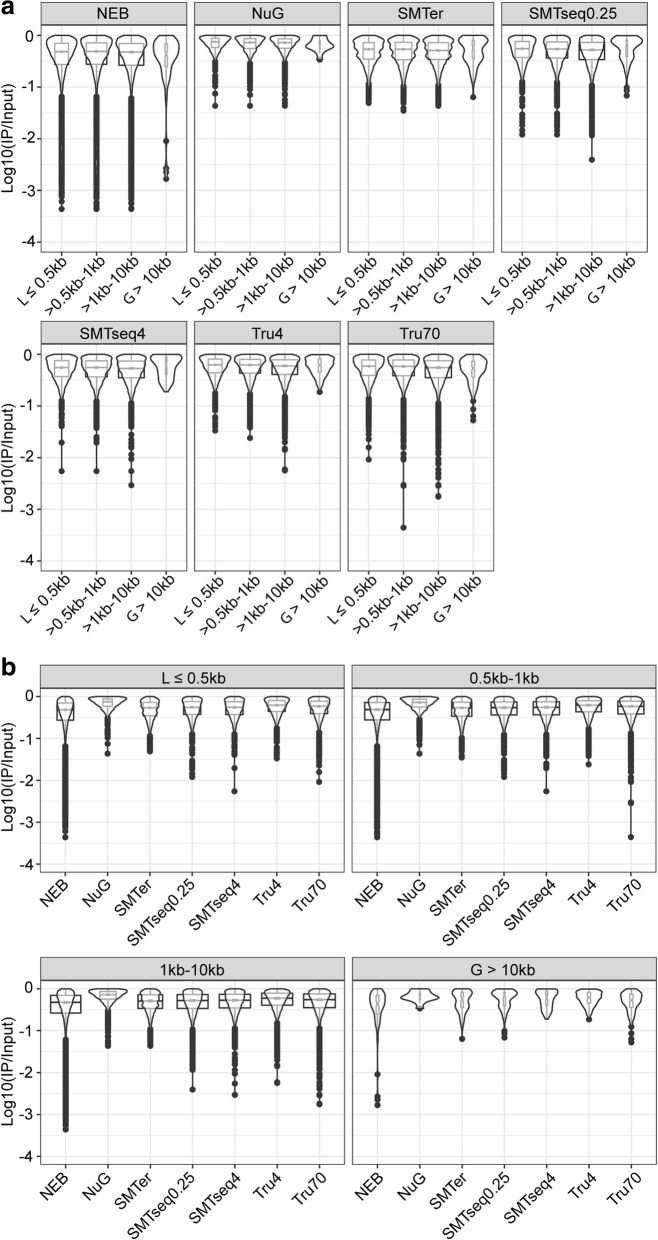
Fig. 10.
Boxplot and violin plots of depletion features over different transcript lengths. a Boxplots of depletion factor of different transcripts within each kit. b Boxplots of depletion factor of different kits at each transcript length bin. The notch represents the median ± 1.58IQR/√n. The width of boxplot is proportion to sample size of each group

