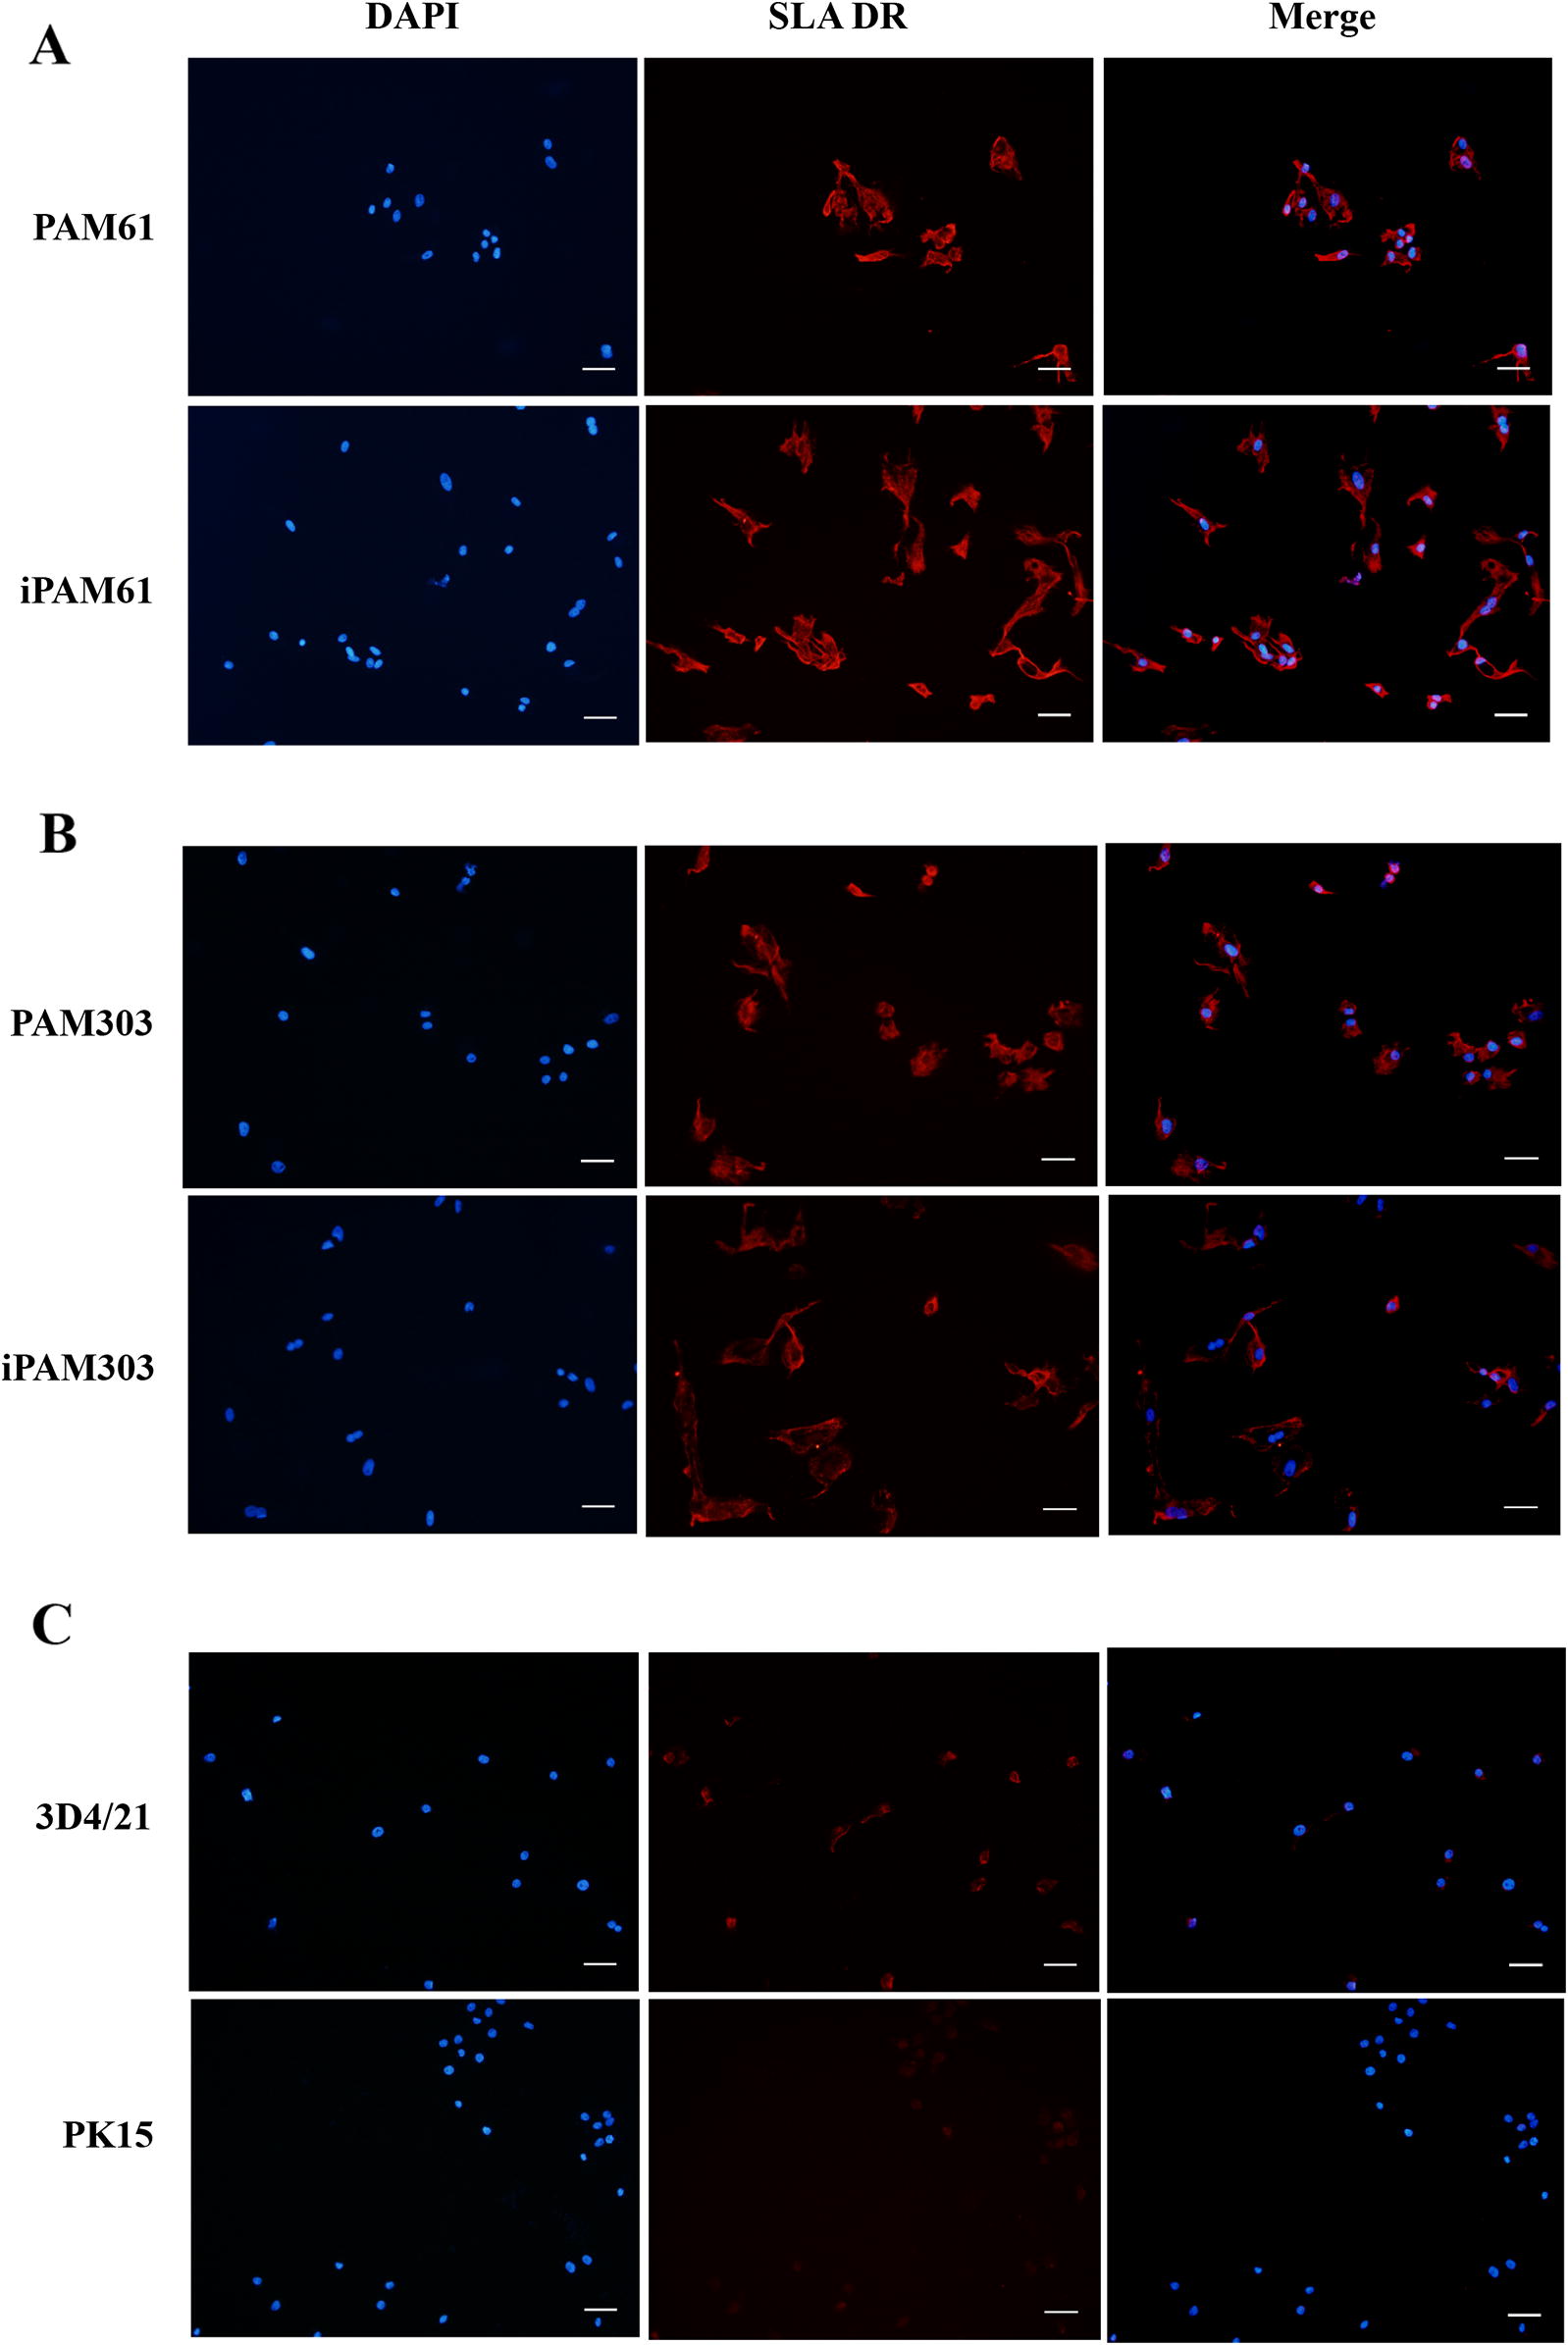
Figure 4.

Comparison of SLA-DR expression levels by immunohistochemical analysis. Primary PAMs, PAM61 (A) and PAM303 (B); immortalized PAMs, iPAM61 (A) and iPAM303 (B). Control cells, 3D4/21 (C) and PK15 (C). The first, second, and third columns show the results from DAPI staining with anti-SLA-DR specific antibody. The third column indicates merged images with ×20 magnification. Scale bar: 100 µm.
