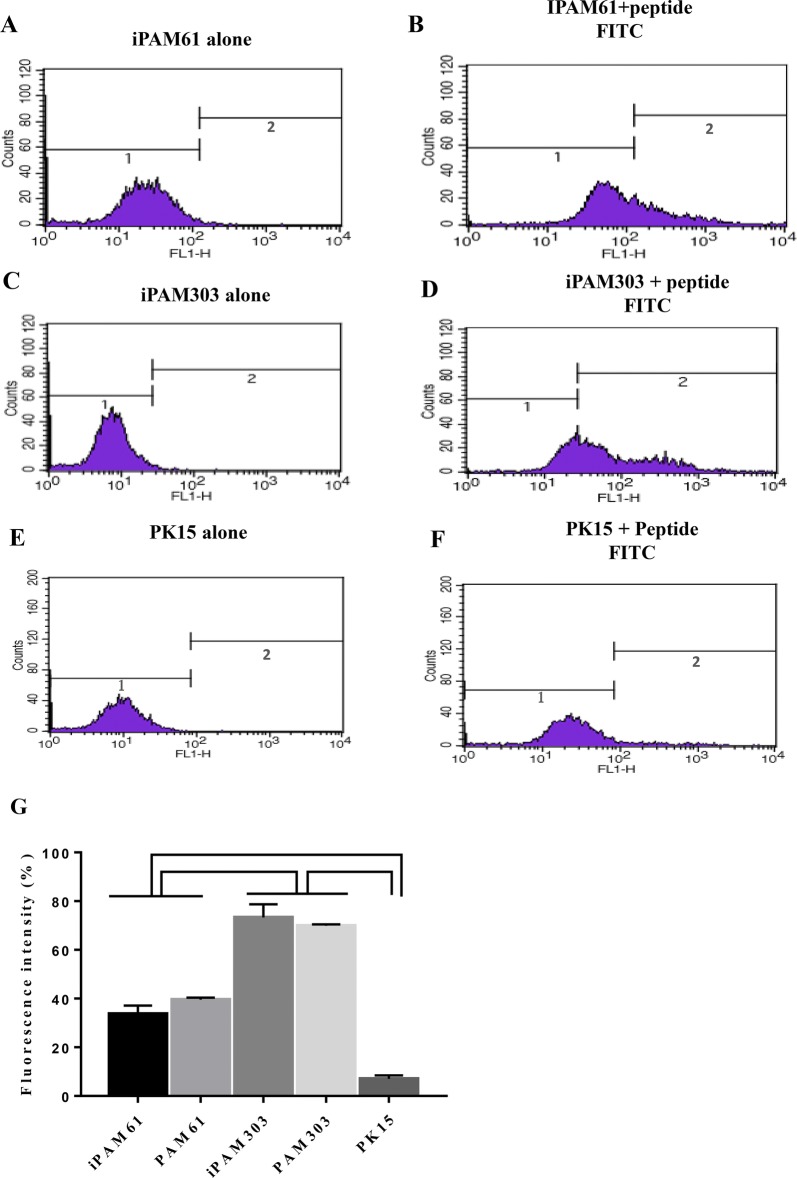
Figure 5.
Comparison of the efficiency of PCV2 ORF2 peptide binding to SLA class II molecules among different cells. The fluorescence levels from SLA-peptide complexes were compared among iPAM61, iPAM303, and PK15. The left (A, C, E) and right (B, D, F) columns indicate groups without and with biotin-labeled peptides, respectively. Fluorescence levels from the SLA-peptide complexes of PAM61 and PAM303 were shown in Additional file 3. Comparison of fluorescence signals from the SLA-peptide complexes of all three types of PAMs were shown (G). Comparisons indicated on top with brackets differ with P < 0.001.

