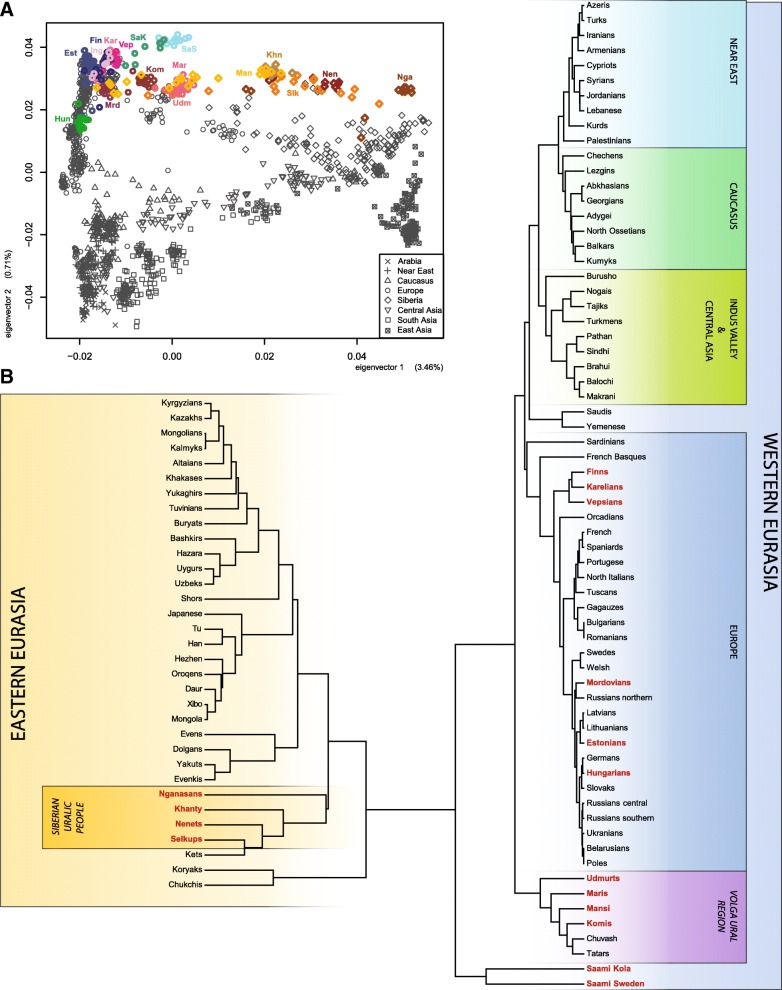
Fig. 2.
Principal component analysis (PCA) and genetic distances of Uralic-speaking populations. a PCA (PC1 vs PC2) of the Uralic-speaking populations (highlighted, population abbreviations are as in Additional file 1: Table S1). Values in brackets along the axes indicate the proportion of genetic variation explained by the components. b UPGMA tree of FST distances calculated based on autosomal genetic variation

