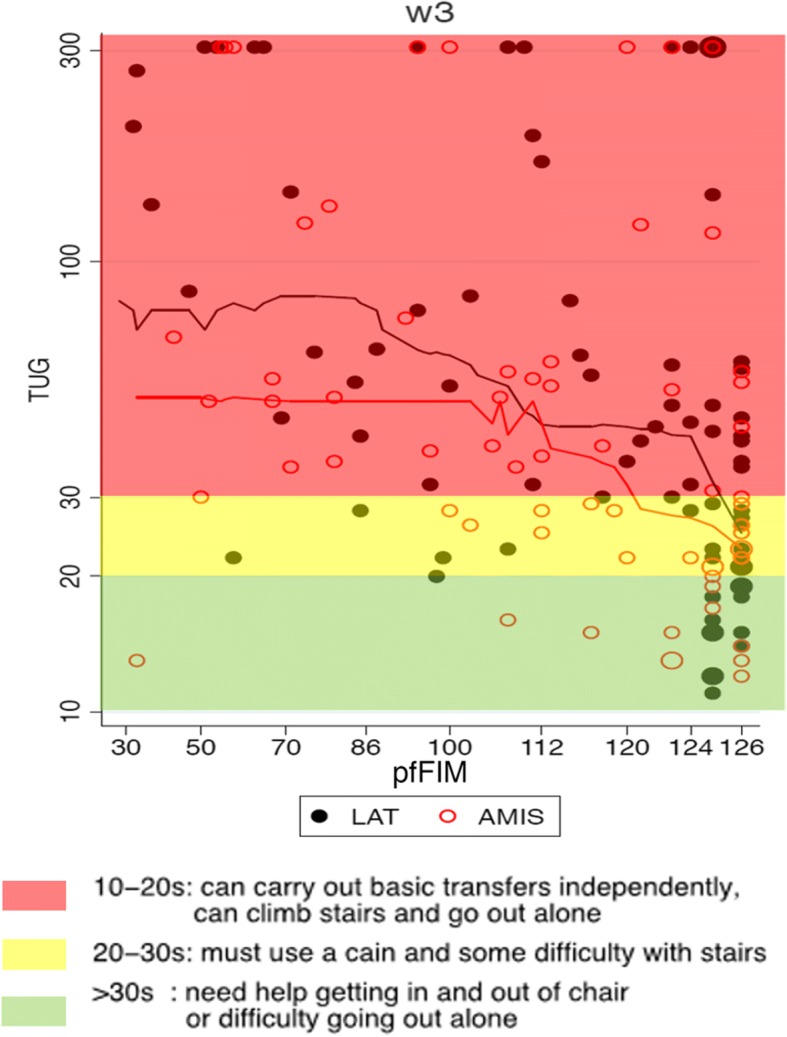
Fig. 3.

The distribution of duration of TUG performance (DTP) at the 3 weeks follow up visit in relation to treatment arm and pfFIM. Visualisation of the duration of TUG performance in the context of its clinical relevance. The green background signifies independence, while the yellow and red imply an increasing degree of dependence for mobilisation (yellow) and basic activities of daily living (red)
