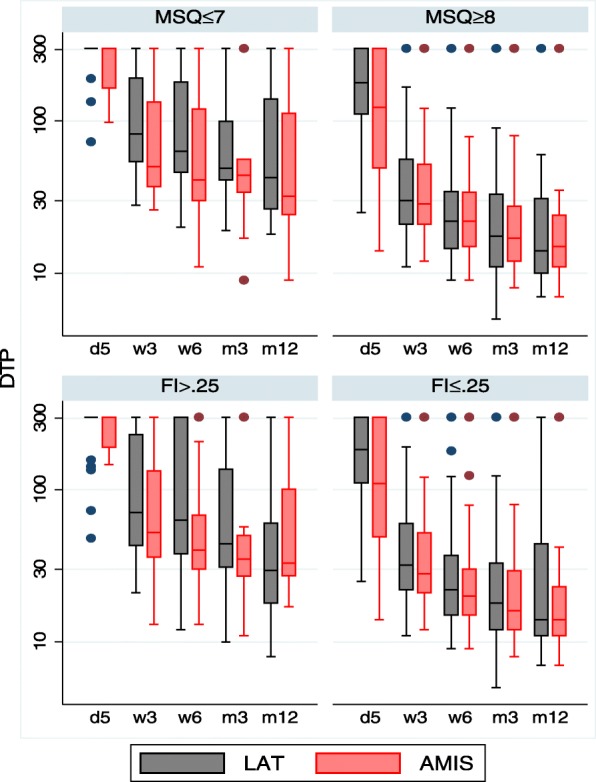
Fig. 5.

The distribution of duration of TUG performance (DTP) at day 5 and at all follow-up visits stratified by treatment arm and by normal and abnormal MSQ-values (upper panel) or by frailty index (lower panel). The figure illustrates larger differences in TUG duration for patients with low abnormal MSQ values or with high frailty index, respectively, especially at early time-points. Note that the y-axis uses a logarithmic scale
