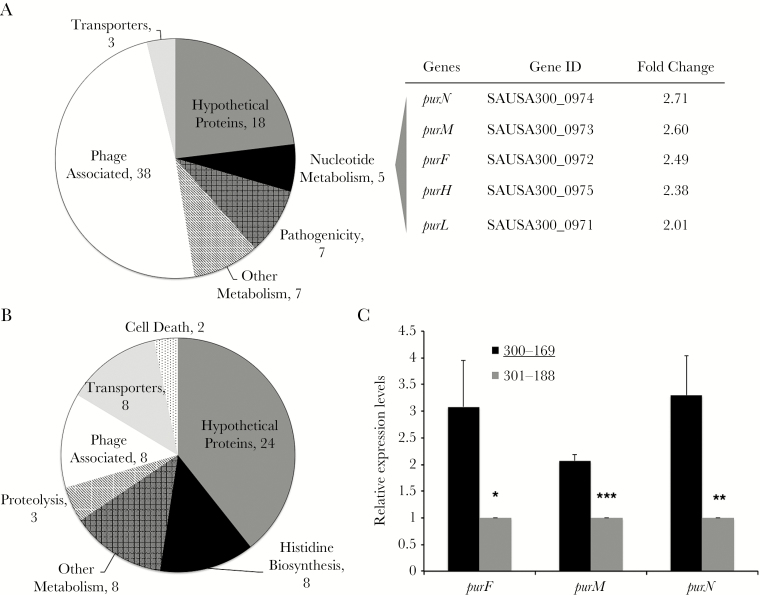
Figure 3.
A and B, Distribution of upregulated (A) and downregulated (B) genes in a representative persistent methicillin-resistant Staphylococcus aureus (MRSA) bacteremia (PB) strain (300-169) versus a resolving MRSA bacteremia (RB) strain (301-188) as determined by microarray analysis after incubation for 3 hours. C, Confirmation of purF, purM, and purN expression in the PB strain (300-169; black, underlined) versus the RB stain (301-188; gray) as determined by quantitative reverse transcription polymerase chain reaction analysis. Primers used were as follows: purF, 5’-CGTGAGCAAGGTGTGAGAGT-3’ and 5’-CGAATTGTCGTACCGCGAAC-3’; purM, 5’-AACGACAGGTGCAGAACCAT-3’ and 5’-TTTCAGCAGTCTCTCCACCG-3’; and purN, 5’-AGCTGGCTACATGCGTCTAA-3’ and 5’-GCCTATTGCGTCAATCCCCT-3’. *P < .01, **P < .001, and ***P < .0001, compared with PB strain 300-169.

