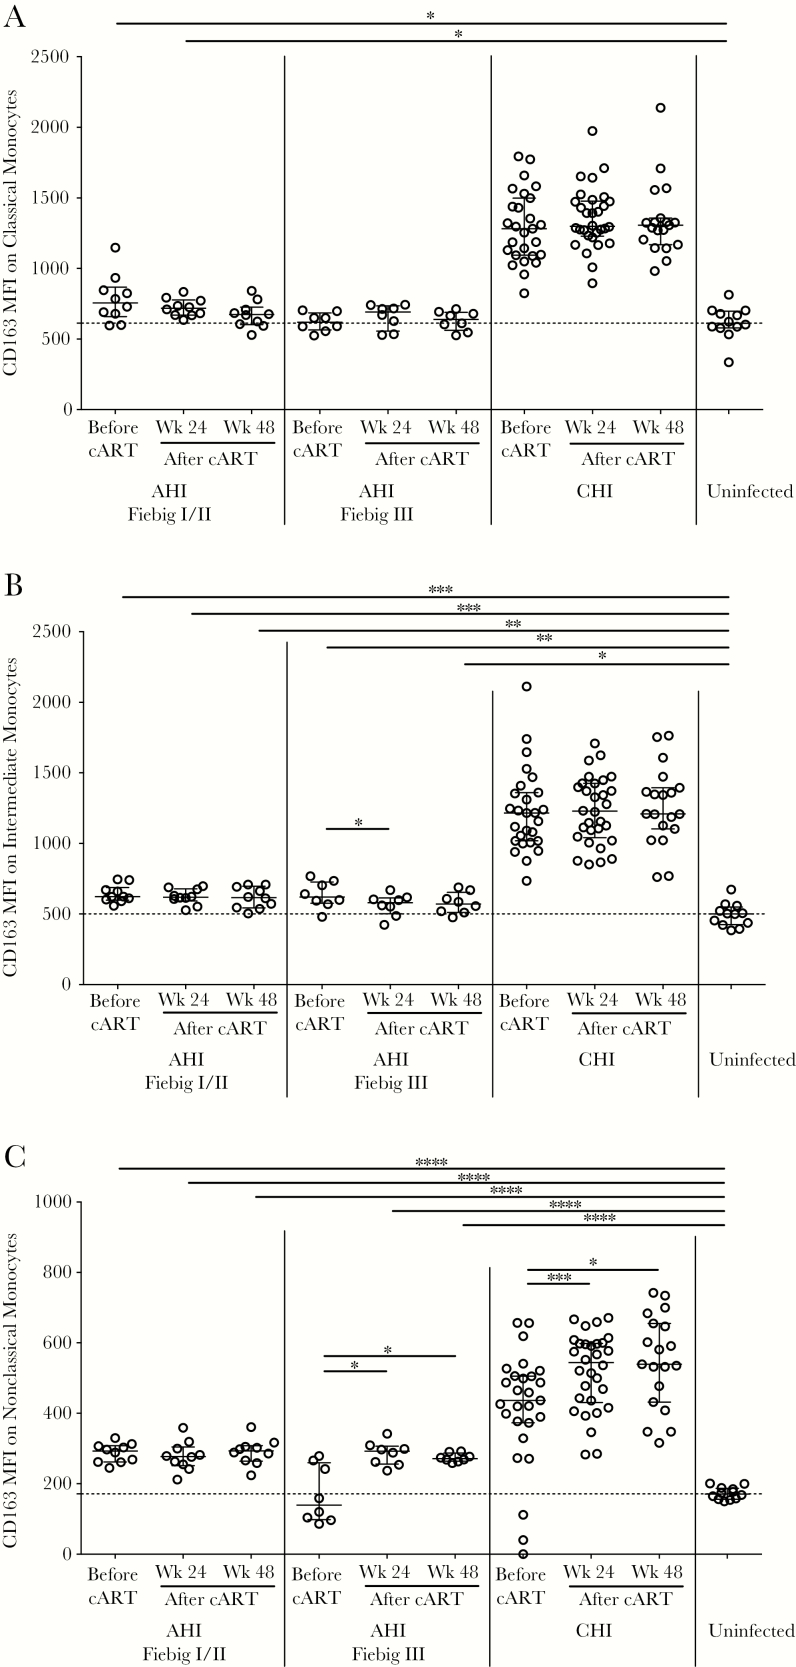
Figure 2.
Geometric mean fluorescence intensity (MFI) of CD163 on classical (A), intermediate (B), and nonclassical (C) monocytes during acute human immunodeficiency (HIV) infection (AHI), by Fiebig stage; during chronic HIV infection (CHI), before and 24 and 48 weeks after combination antiretroviral therapy (cART) initiation; and in HIV- uninfected controls. Data are presented as medians and interquartile ranges. Dashed lines indicate the median level for HIV-uninfected controls. P values were calculated by Wilcoxon rank sum tests (for comparisons between groups) and Wilcoxon signed rank tests (for comparisons within groups), without adjustment for multiple comparisons. *P < .05, **P < .01, ***P < .001, and ****P < .0001.

