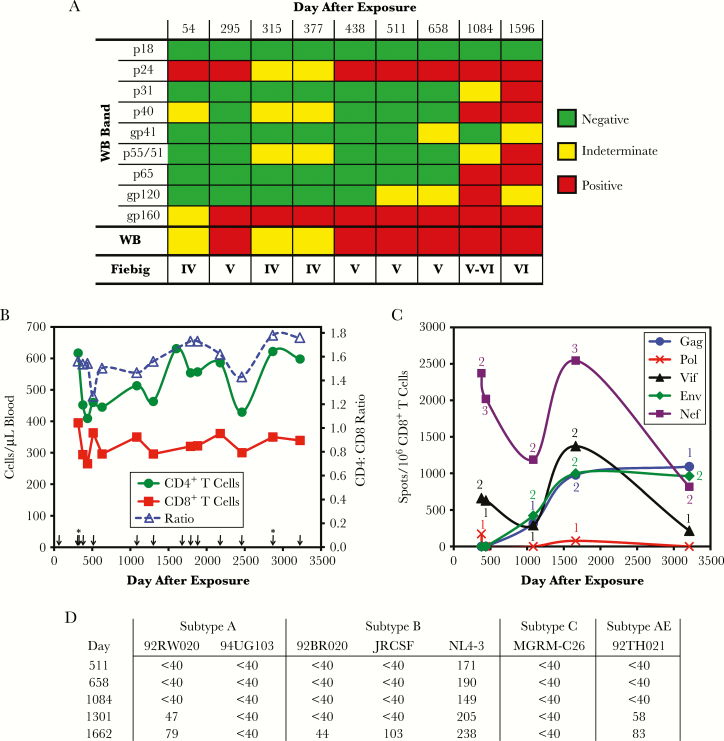
Figure 1.
Immune parameters. (A) Western blot results, including individual bands and overall interpretation are given. The Fiebig stage according to these results is indicated. (B) Peripheral blood T-cell counts are plotted by time after exposure. Arrows indicate plasma human immunodeficiency virus (HIV)-1 ribonucleic acid tests, which all yielded undetectable viremia (<48 copies/mL for tests performed up to day 512, and <20 copies/mL for tests performed after day 512), with the exception of detected viremia below the linear range of quantitation on days 315 and 2868 (indicated by *). (C) Frequencies of CD8+ T-cell responses defined by enzyme-linked immune spot assay using a library of peptides spanning the HIV-1 subtype B sequence whole proteome are plotted. The number labels additionally indicate the number of epitope regions targeted at each time point (recognized 15-mer peptide in isolation or overlap between 2 consecutive overlapping 15-mer peptides). (D) Neutralizing antibody titers are expressed as 1/highest serum dilution to achieve 50% inhibitory concentration of the indicated Env-pseudotyped virions.

