
Figure 2.
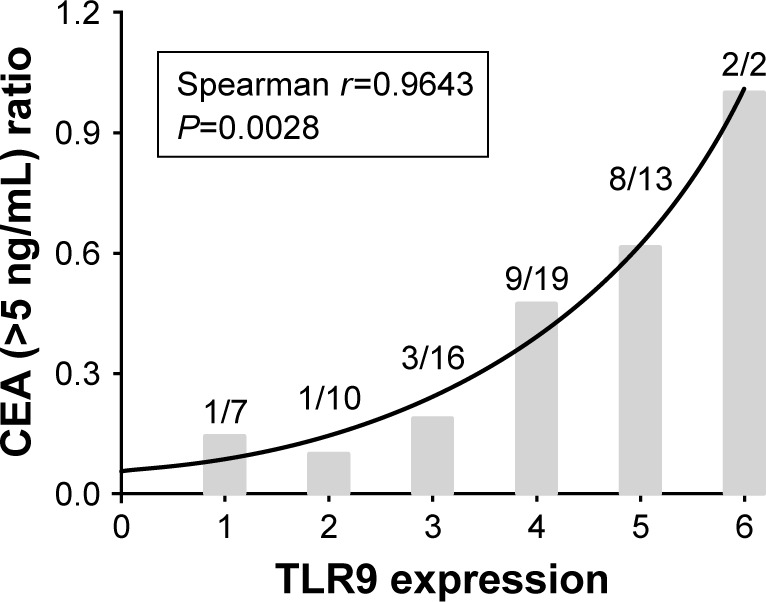
The relationship between TLR9 expression in cancer tissues and the ratio of patients on increasing CEA (>5 ng/mL) in blood.
Notes: The curve-fitting statistical analysis was used in dealing with the relationship of TLR9 expression in cancer tissues and the ratio of patients on increasing CEA (>5 ng/mL) pre operation. The number in the diagram is the ratio of CEA (>5 ng/mL) corresponding to TLR9 expression score, becoming added with high expression of TLR9. Spearman correlation coefficient was 0.9643, and the P-value was 0.0028. The R2 value of the curve using the correlation fitting method was 0.9786. This result illustrated that TLR9 signal activation emerged more easily in colorectal cancer with an abnormal increase in CEA.