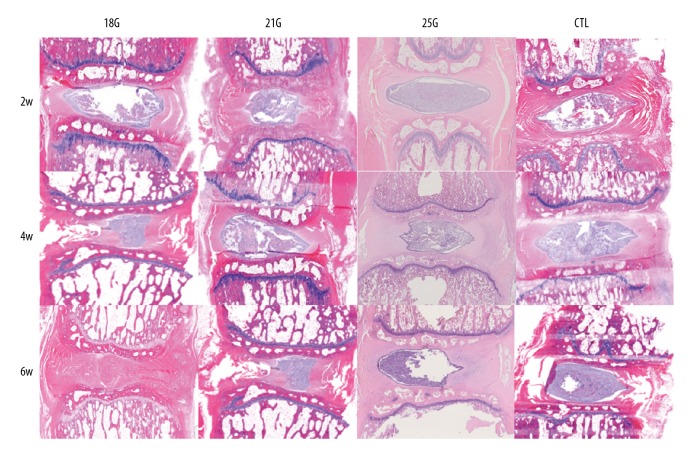
Figure 3.
HE staining sections of the rat tail discs punctured by all sizes of needles, obtained at different time points. The control group exhibited intact AF, rounded NP and well-defined border between them, whereas the punctured discs exhibited disordered AF, fewer NP cells, and with an interrupted border (HE, 40×). CTL – control.

