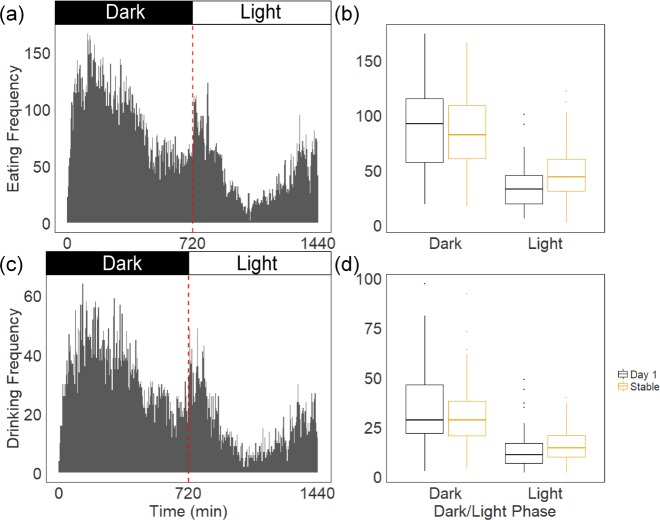
Figure 2. Total frequency of eating and drinking in 24 h of all individuals observed on Day 1 of hierarchy formation and after stable hierarchies were established.
(A, C) The first half of observation period was in dark cycle (minute 0 to 720) and the rest half was in light cycle (721 to 1,440). Mice eat and drink more frequently in the dark cycle both on Day 1 and after the hierarchies are established. (B, D) There was a significant interaction effect between dark/light phases and stability of hierarchies on eating and drinking frequency. Boxplots show median (horizontal bars), IQR (boxes) and 95% CI (whiskers).

