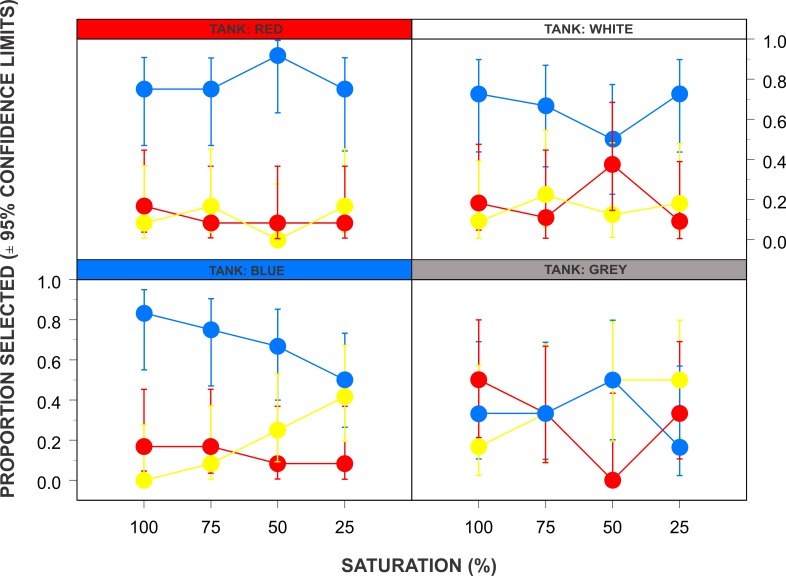
Figure 2. The relationships between tank colour, background colour and shading on food choice in the sea turtle Chelonia mydas.
The probability of a hatchling green turtle (Chelonia mydas) selecting food on a particular coloured plate (blue, yellow or red) in relation to the stimuli saturation (100, 75, 50, or 25%) and rearing tank colour (red, white, blue or grey). Symbol colours match that of the chosen coloured plate.

