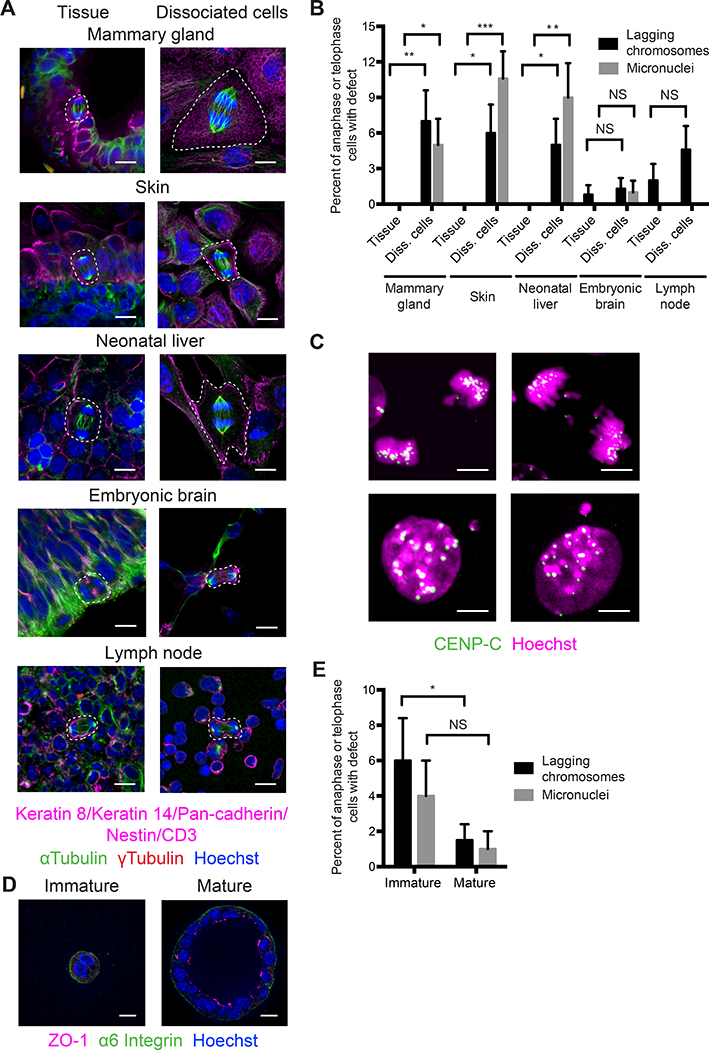
Figure 1. Tissue architecture is required for chromosome segregation fidelity in epithelia.

(A) Images of mitotic cells (dashed white outline) in tissue and dissociated cells from mammary gland, skin, neonatal liver, embryonic brain, and lymph node immunostained for epithelial or cell type-specific markers (magenta), αtubulin (green), and ϒtubulin (red). DNA is stained with Hoechst (blue). Scale bars, 10 μm.
(B) Prevalence of lagging chromosomes (black bars) and micronuclei (grey bars) in tissues and dissociated cells. Error bars represent standard deviation. P values are: p = 0.007 for lagging chromosomes in mammary gland tissue versus dissociated cells, p = 0.03 for micronuclei in mammary gland tissue versus dissociated cells, p = 0.01 for lagging chromosomes in skin tissue versus dissociated cells, p = 0.0004 for micronuclei in skin tissue versus dissociated cells, p = 0.03 for lagging chromosomes in neonatal liver tissue versus dissociated cells, and p = 0.002 for micronuclei in neonatal liver tissue versus dissociated cells by one-tailed Fisher’s exact test. NS, not significant. n ≥ 2 biological replicates totaling ≥ 100 anaphase cells and ≥ 100 telophase cells per condition.
(C) Images of lagging chromosomes (arrowheads) in a dissociated keratinocyte (top panel, left) and a neonatal hepatocyte (top panel, right) and micronuclei (arrowheads) in dissociated mammary epithelial cells (bottom panel) immunostained for the centromere (CENP-C, green). DNA is stained with Hoechst (magenta). Scale bars, 5 μm.
(D) Images of immature and mature spheroids after 48 and 96 hours of culture in Matrigel, respectively, immunostained for ZO-1 (magenta) and α6 integrin (green). DNA is stained with Hoechst (blue). Scale bars, 10 μm.
(E) Prevalence of lagging chromosomes (black bars) and micronuclei (grey bars) in immature and mature spheroids. Error bars represent standard deviation. p = 0.04 for lagging chromosomes in immature versus mature spheroids by one-tailed Fisher’s exact test. NS, not significant. n ≥ 2 biological replicates totaling ≥ 100 anaphase cells and ≥ 100 telophase cells per condition.
See also Figure S1.
