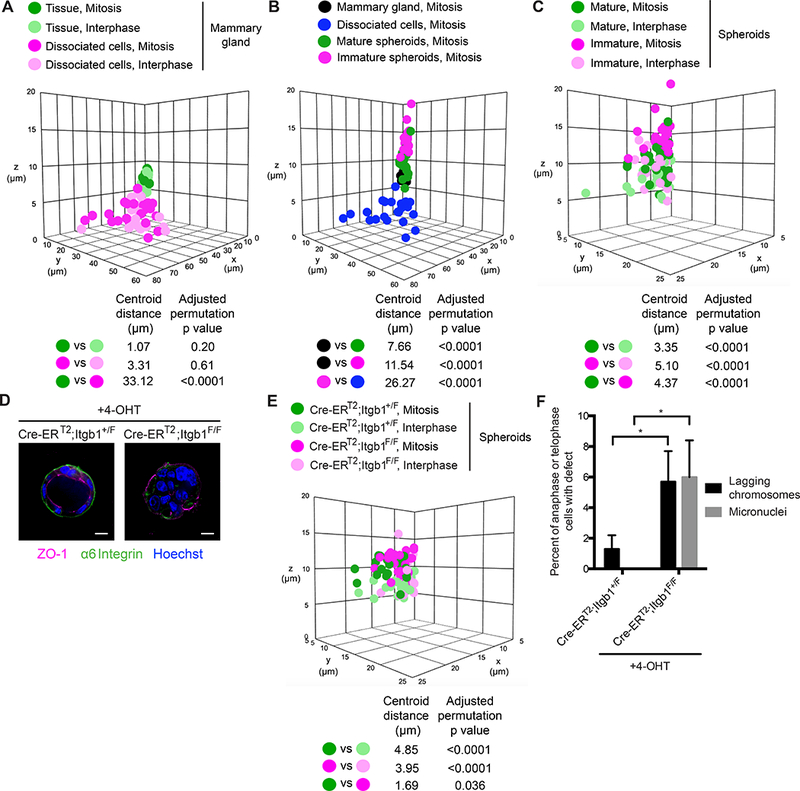
Figure 2. Integrin function is required for chromosome segregation fidelity.

(A) Dimensions of mitotic (dark circles) and interphase (light circles) mammary epithelial cells in mammary gland (green circles) and as dissociated cells (pink circles). For dissociated cells, the z dimension always corresponds to the height of the cell relative to the coverslip. The distance between the centroids (in μm) of select pairs of conditions and the adjusted permutation p value using the Benjamini and Hochberg method for multiple comparisons are indicated below the graph. n = 2 biological replicates with ≥ 10 cells per replicate per condition.
(B) Dimensions of mitotic mammary epithelial cells in mammary gland (black circles), as dissociated cells (blue circles), in mature spheroids (green circles), and in immature spheroids (pink circles). n = 2 biological replicates with ≥ 10 cells per replicate per condition. The mitotic cells from mammary gland and dissociated cells are replotted from Figure 2A.
(C) Dimensions of mitotic (dark circles) and interphase (light circles) cells in mature (green circles) and immature (pink circles) spheroids. n = 2 biological replicates with ≥ 10 cells per replicate per condition. The mitotic cells from immature and mature spheroids are replotted from Figure 2B.
(D) Images of control (Cre-ERT2; Itgb1+/F) and β1 integrin knockout (Cre-ERT2; Itgb1F/F) spheroids treated with 4-hydroxytamoxifen (4-OHT) immunostained for ZO-1 (magenta) and α6 integrin (green). DNA is stained with Hoechst (blue). Scale bars, 10 μm.
(E) Dimensions of mitotic (dark circles) and interphase (light circles) cells in control and β1 integrin knockout spheroids treated with 4-hydroxytamoxifen (4-OHT). n = 2 biological replicates with ≥ 10 cells per replicate per condition.
(F) Prevalence of lagging chromosomes (black bars) and micronuclei (grey bars) in control and β1 integrin knockout spheroids treated with 4-hydroxytamoxifen (4-OHT). Error bars represent standard deviation. P values are: p = 0.047 for lagging chromosomes in control versus β1 integrin knockout spheroids and p = 0.01 for micronuclei in control versus β1 integrin knockout spheroids by one-tailed Fisher’s exact test. n = 2 biological replicates totaling ≥ 100 anaphase cells and ≥ 100 telophase cells per condition.
See also Figure S2.
