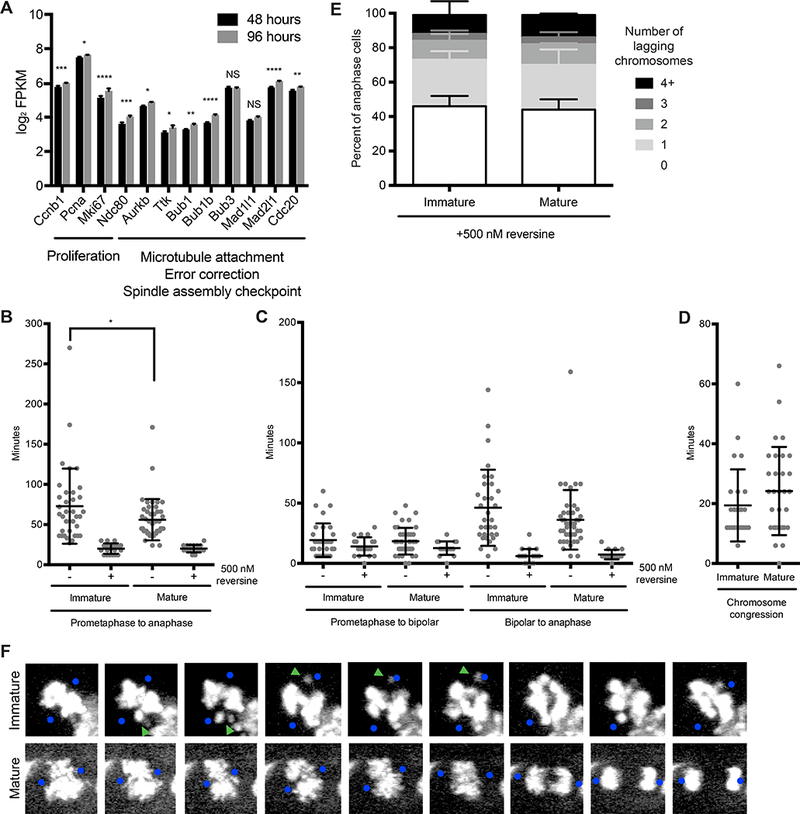
Figure 3. Tissue architecture enhances the correction of merotelic microtubule-kinetochore attachments.

(A) Average expression (log2 FPKM) of genes involved in proliferation and chromosome segregation in spheroids cultured for 48 or 96 hours in Matrigel. Error bars represent standard deviation. P values are: p = 0.00046 (Ccnb1), 0.01 (Pcna), 2.1 × 10⁻⁸ (Mki67), 0.00044 (Ndc80), 0.01 (Aurkb), 0.039 (Ttk), 0.0047 (Bub1), 2.2 × 10⁻⁷ (Bub1b), 3.2 × 10⁻⁶ (Mad2l1), 0.0035 (Cdc20) by Wald test adjusted for multiple testing by the Benjamini and Hochberg method. NS, not significant. n = 3 biological replicates per condition.
(B) Time elapsed from prometaphase to anaphase in mitotic mammary epithelial cells in Centrin 2-GFP;H2B-mCherry immature and mature spheroids in the absence (−) and presence (+) of 500 nM reversine. Horizontal lines represent mean and standard deviation. p = 0.04 for immature and mature spheroids in the absence of reversine by two-tailed unpaired t-test. n ≥ 2 biological replicates totaling ≥ 16 mitoses per condition.
(C) Time elapsed from prometaphase to the establishment of a bipolar spindle and the establishment of a bipolar spindle to anaphase in mitotic mammary epithelial cells in Centrin 2-GFP;H2B-mCherry immature and mature spheroids in the absence (−) and presence (+) of 500 nM reversine. Horizontal lines represent mean and standard deviation. n ≥ 2 biological replicates totaling ≥ 16 mitoses per condition.
(D) Duration of chromosome congression in mitotic mammary epithelial cells in Centrin 2-GFP;H2B-mCherry immature and mature spheroids. Horizontal lines represent mean and standard deviation. n ≥ 2 biological replicates totaling > 25 mitoses per condition.
(E) Quantification of lagging chromosomes in anaphase of mammary epithelial cells in immature and mature spheroids in the presence of 500 nM reversine. Error bars represent standard deviation. n = 2 biological replicates with > 35 anaphase cells per replicate per condition.
(F) Time lapse images of mitotic mammary epithelial cells in Centrin 2-GFP;H2B-mCherry immature (top panel) and mature (bottom panel) spheroids. Blue dots represent the position of Centrin 2-GFP foci when they could be visualized. Green arrowheads mark chromosomes expelled from the metaphase plate in immature spheroids. Number indicates minutes since prometaphase onset. Only the H2B-mCherry signal (white) is shown.
See also Figure S3.
