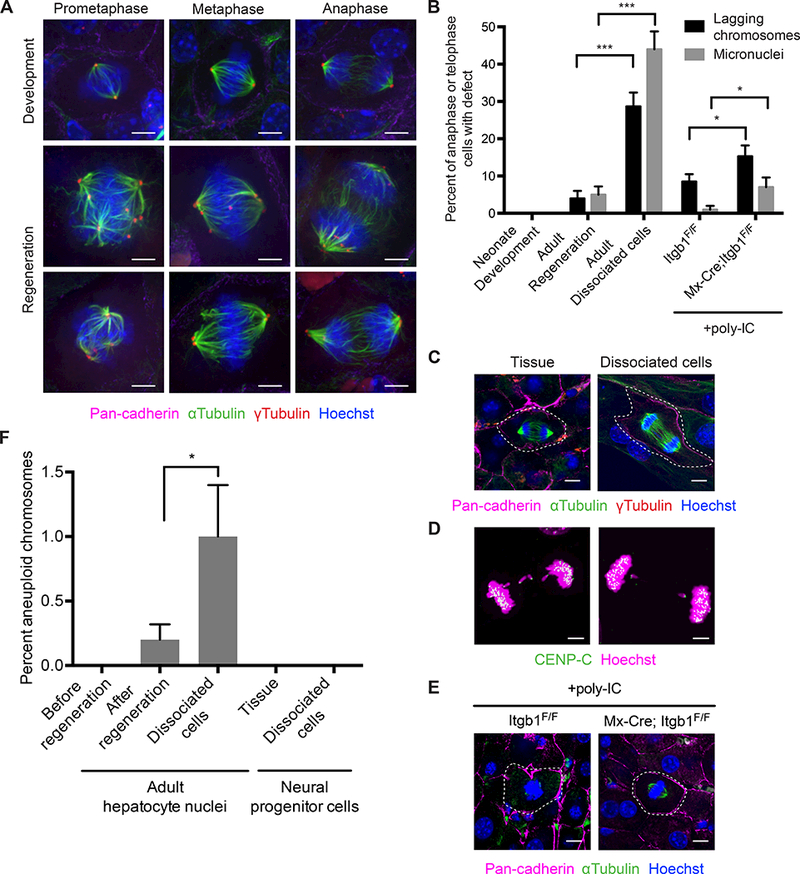
Figure 4. Tissue architecture is especially important for chromosome segregation fidelity in the polyploid liver.

(A) Images of mitotic hepatocytes in prometaphase, metaphase, and anaphase in liver during neonatal development and adult regeneration immunostained for pan-cadherin (magenta), αtubulin (green), and ϒtubulin (red). DNA is stained with Hoechst (blue). Scale bars, 5 μm.
(B) Prevalence of lagging chromosomes (black bars) and micronuclei (grey bars) of hepatocytes in liver during neonatal development and adult regeneration, in dissociated cells from adult liver, and in control (Itgb1F/F) and β1 integrin knockout (Mx-Cre; Itgb1F/F) liver during adult regeneration after treatment with poly-IC. Error bars represent standard deviation. P values are: p = 0.0001 for lagging chromosomes in adult regeneration versus dissociated cells, p = 0.0001 for micronuclei in adult regeneration versus dissociated cells, p = 0.035 for lagging chromosomes in control versus β1 integrin knockout liver, and p = 0.03 for micronuclei in control versus β1 integrin knockout liver by one-tailed Fisher’s exact test. n ≥ 2 biological replicates totaling ≥ 100 anaphase cells and ≥ 100 telophase cells per condition.
(C) Images of mitotic hepatocytes (dashed white outline) from adult liver during regeneration and dissociated cells from adult liver immunostained for pan-cadherin (magenta), αtubulin (green), and ϒtubulin (red). DNA is stained with Hoechst (blue). Scale bars, 10 μm.
(D) Images of lagging chromosomes (arrowheads) in dissociated adult hepatocytes immunostained for the centromere (CENP-C, green). DNA is stained with Hoechst (magenta). Scale bars, 5 μm.
(E) Images of mitotic hepatocytes (dashed white outline) from control and β1 integrin knockout liver during adult regeneration immunostained for pan-cadherin (magenta), and αtubulin (green). DNA is stained with Hoechst (blue). Scale bars, 10 μm.
(F) Percent of aneuploid chromosomes in adult hepatocyte nuclei from liver before regeneration, after regeneration, and after expansion as dissociated cells, and neural progenitor cells from embryonic brain and after expansion as dissociated cells as determined by single nucleus or cell sequencing. Data for liver before regeneration and embryonic brain are from Knouse et al. 2014. p = 0.025 for adult hepatocyte nuclei after regeneration versus after expansion as dissociated cells by one-tailed Fisher’s exact test. n ≥ 1 biological replicate totaling > 25 nuclei or cells per condition.
See also Figure S4.
