
Figure 2.
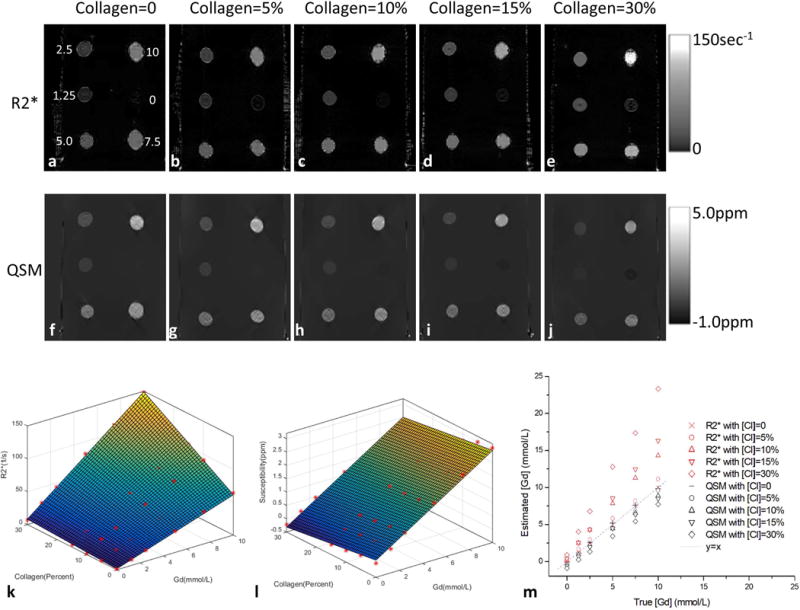
(a–e) R2* and (f–j) susceptibility images of the five collagen-water-Gd phantoms with balloons of varying Gd concentration ([Gd]) and collagen concentration ([Cl]). (k&l) plots of R2* and magnetic susceptibility values versus [Gd] and [Cl]: R2* had a quadratic term [Cl][Gd] while susceptibility had only linear terms. (m) plots of true [Gd] versus estimated [Gd] which were calculated using the relationship without collagen as a reference.