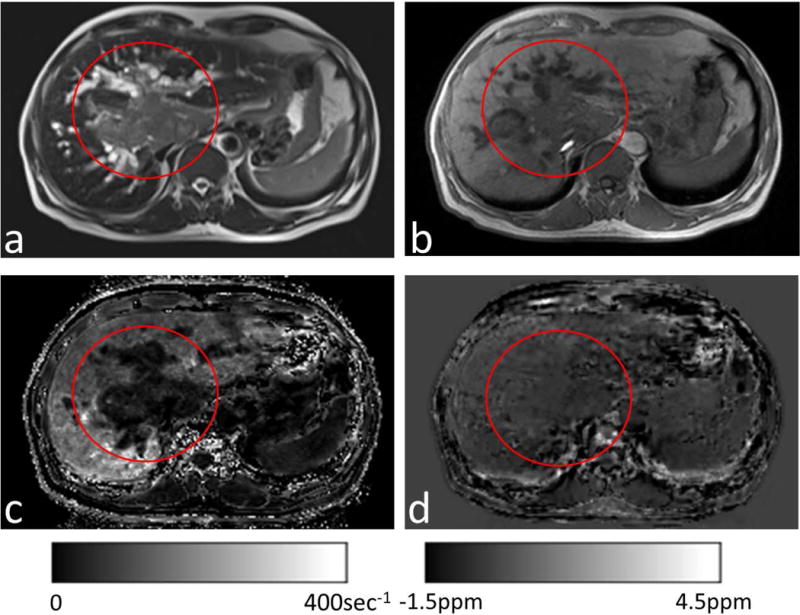
Figure 5.

(a) T2-weighted and (b)T1-weighted images from a patient with suspected HCC (red circles). (c) Corresponding R2* maps and (d) susceptibility maps without χFat. The tumor showed a slight increase in water and consequently very small R2*(c). The normal-appearing liver (outside the red circle) had substantial fat, which substantially increased R2* (c) but only slightly affected QSM (d).
