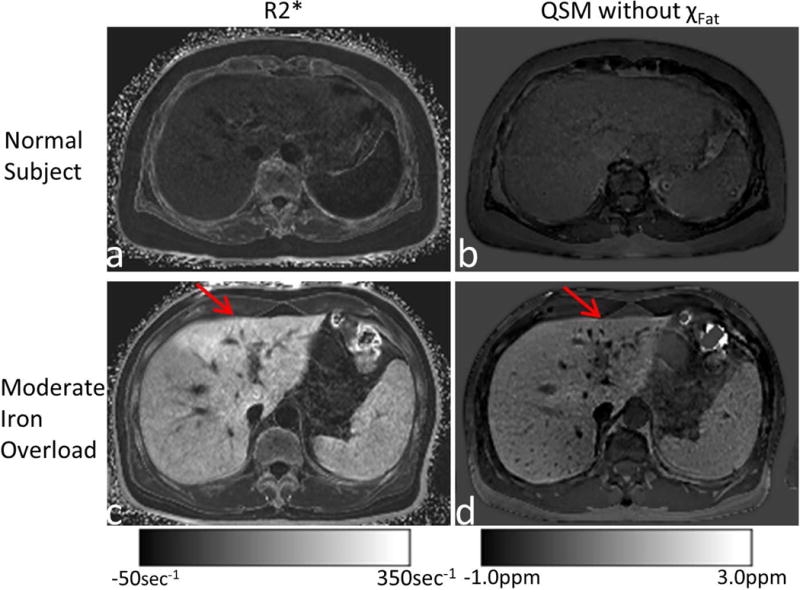
Figure 7.

R2* (left column) and susceptibility (right column) maps from a normal subject (top row) and a patient with moderate iron overload (bottom row). For the patient with moderate iron overload, there was suspected fibrosis in the left lobe (red arrows), which increased R2* but did not affect QSM.
