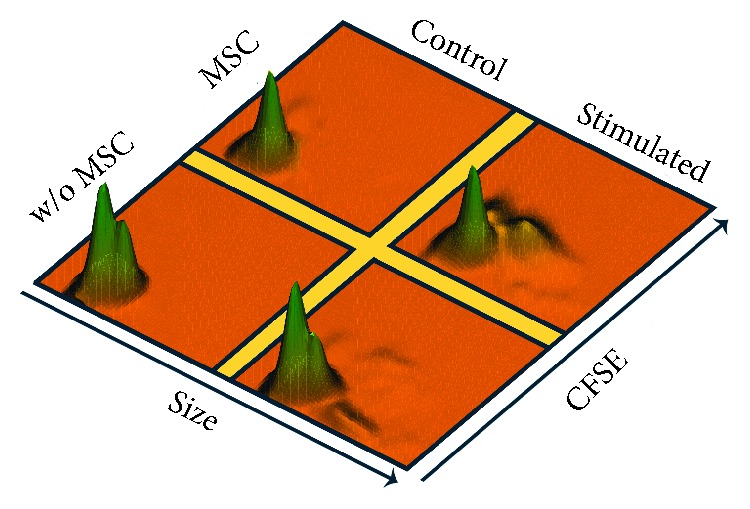
Figure 3.

3D histograms of MSC-CD8+ lymphocyte cocultures, showing proliferation versus cell size. Ratio: MSC : lymphocytes (1 : 10). The height of the histogram is proportional to the number of cells. Top, without stimulus and with MSC; left, without stimulus and without MSC; right, with stimulus and with MSC; bottom, with stimulus and without MSC. Histogram representative of one of nine cocultures.
