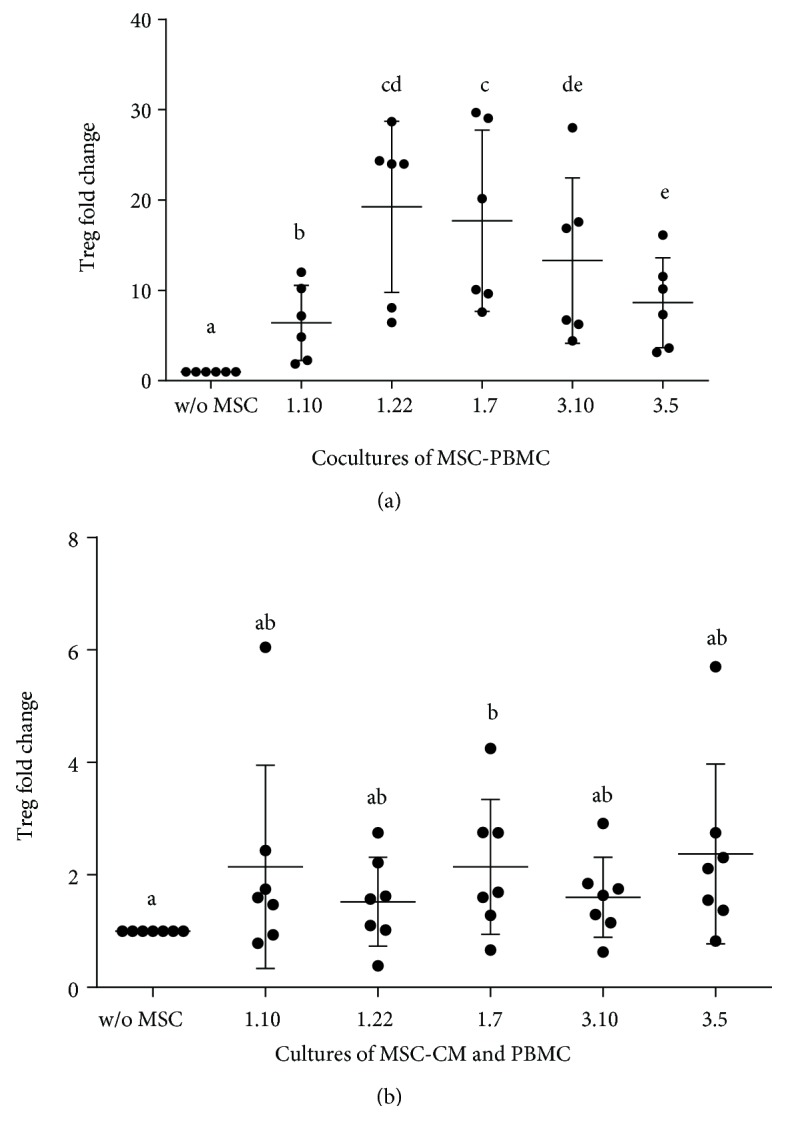
Figure 5.

Fold change of Treg cells. (a) In cocultures of PBMC and different MSC clones. Ratio: MSC : PBMCs (1 : 10) (n = 6). (b) In cultures of PBMC supplemented with conditioned media from different MSC clones (n = 8). Results expressed as median (SD). p values obtained by ANOVA (LSD test) (p < 0.05). Means containing equal letters are not significant to each other (p < 0.05).
