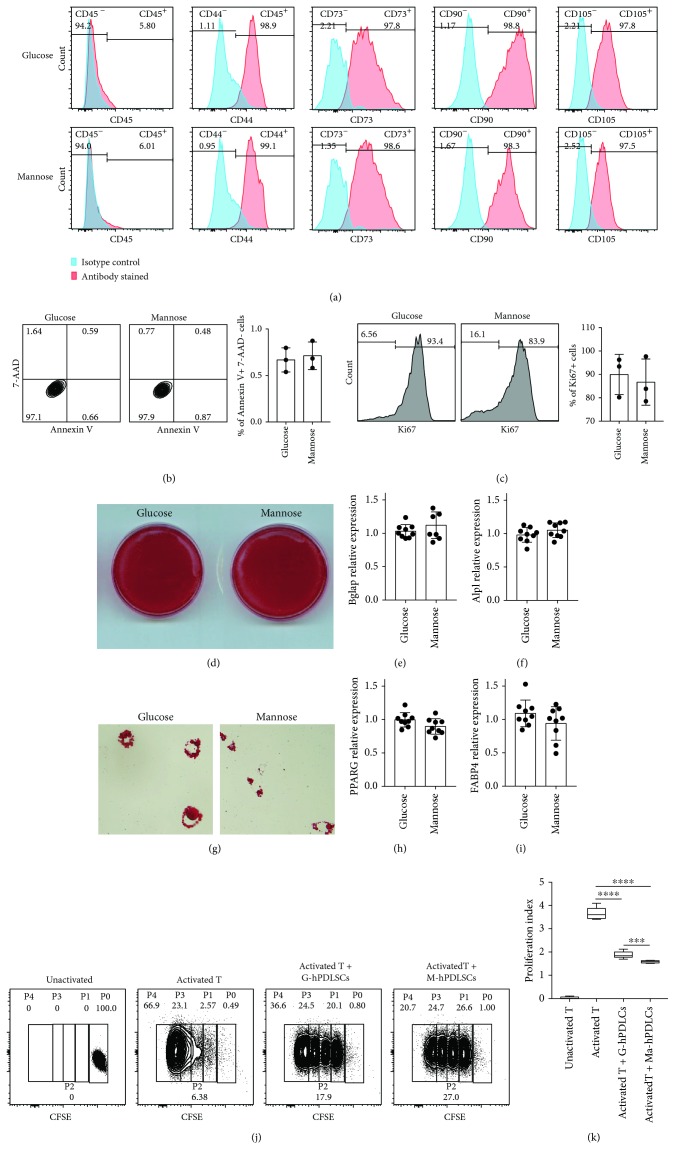
Figure 1.
M-hPDLSCs have more inhibitory ability to proliferate T cells. (a) CD45, CD44, CD73, CD90, and CD105 have been detected by flow cytometry. There is no difference between M-hPDLSCs and G-hPDLSCs. (b, c) The apoptosis and proliferation of hPDLSCs between D-mannose and glucose treatment had no significant differences. (d–f) Osteogenic differentiation ability of M-hPDLSCs and G-PDLSCs has been detected. M-hPDLSCs and G-hPDLSCs were induced osteogenic differentiation. Alizarin red staining, BGLAP, and ALPL levels showed that M-PDLSCs have the same osteogenic differentiation ability as G-PDLSCs. (g–i) M-hPDLSCs and G-hPDLSCs were induced to adipogenic differentiation. Oil Red O staining, PPARG, and FABP4 levels showed that M-PDLSCs have the same adipogenic differentiation ability as G-hPDLSCs. (j, k) M-hPDLSCs and G-PDLSCs were cocultured with T cell to detect the effect of both on T cell proliferation. Both M-PDLSCs and G-PDLSCs could impair T cell proliferation. Compared with G-PDLSCs, M-hPDLSCs has more T cell proliferation inhibitory ability. Student's t test was used to analyze statistical significance. All error bars represent s.d. (n = 9). ∗∗∗P ≤ 0.001 and ∗∗∗∗P ≤ 0.0001.

