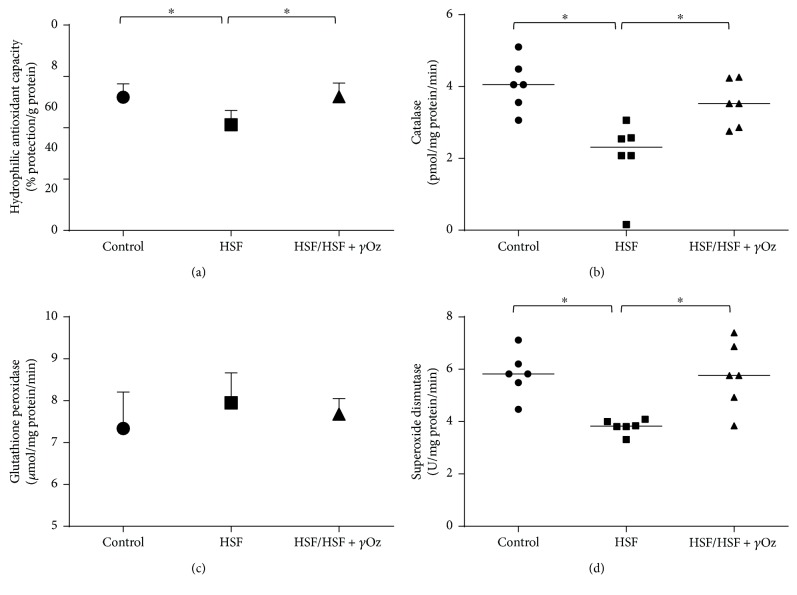
Figure 4.
Redox state parameters in the kidney: (a) hydrophilic antioxidant capacity (% protection/g protein); (b) catalase (pmol/mg protein/min); (c) glutathione peroxidase (μmol/mg protein/min); (d) superoxide dismutase (U/mg protein/min). Data expressed in mean ± standard deviation. Comparison by one-way ANOVA with Tukey post hoc. ∗ indicates p < 0.05; n = 6 animals/group.

