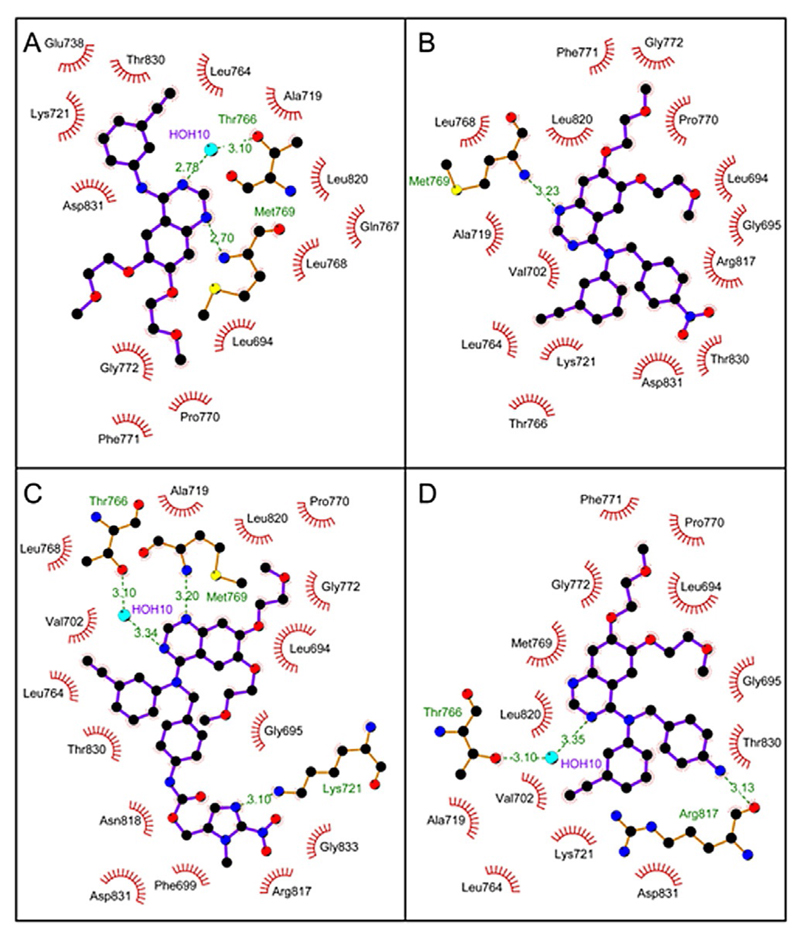
Figure 6.
Schematic 2D diagrams of protein–ligand interactions for EGFR in complex with A) erlotinib (PDB ID: 1M17), B) 2a, C) 2c, and D) 2b. Hydrogen bonds are indicated by dashed lines, while hydrophobic contacts are represented by an arc with spokes radiating toward the ligand atoms they contact. The contacted atoms are shown with spokes radiating back.

