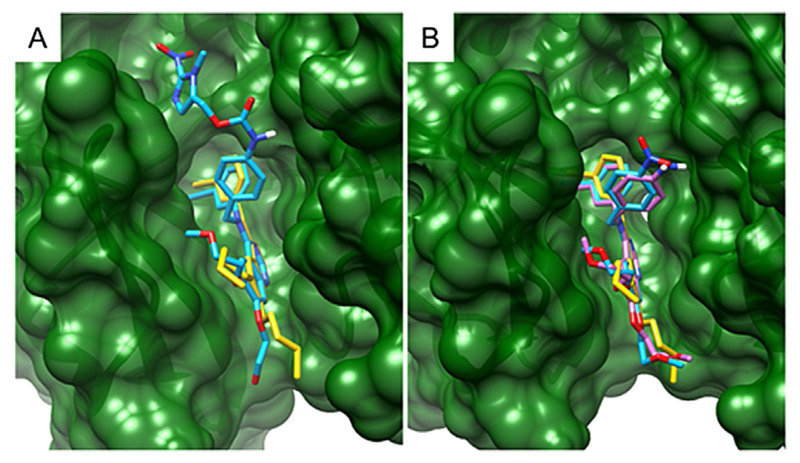
Figure 7.
3D structures of A) erlotinib and compound 2c, and B) erlotinib, 2a and 2b in complex with EGFR. The structure of the EGFR–erlotinib complex was obtained from PDB ID: 1M17. The protein is depicted in ribbon representation colored in green and was rendered as a surface representation. Compounds are shown in capped stick representation and colored as follows: A) erlotinib in gold, 2c in sky blue; B) erlotinib in gold, 2a in sky blue and 2b in magenta. The pictures were generated using Chimera.

