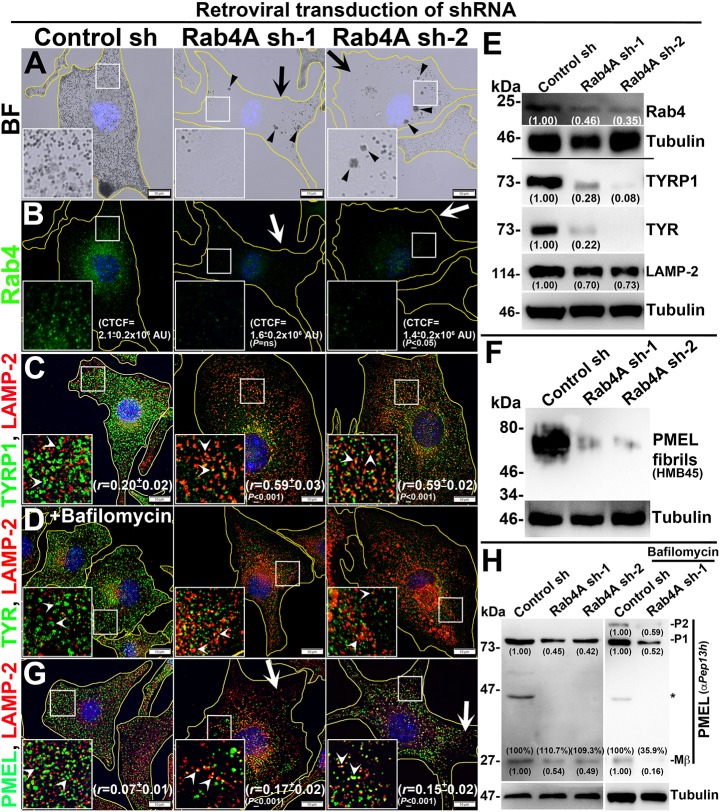
Fig. 1.
Rab4A-knockdown affects melanocyte pigmentation and cargo transport to melanosomes. BF (A) and IFM (B–D,G) images of Rab4A-depleted (sh-1 and sh-2) and control melanocytes. Black arrows and arrowheads indicate the pigmentation loss and melanosome clusters, respectively (A). White arrows indicate the loss in fluorescence staining of Rab4 (B) or PMEL (G) in knockdown cells. White arrowheads (C,D,G) point to the cargo localization to lysosomes. In D, cells were treated with bafilomycin. Nuclei are stained with Hoechst 33258. The insets are a magnified view of the white boxed areas. The Pearson's coefficient (r) between the two markers and CTCF values are indicated separately (mean±s.e.m.). Scale bars: 10 µm. (E,F,H) Immunoblotting analysis of Rab4, melanosomal and lysosomal proteins, and PMEL fibrils in Rab4A-knockdown cells. Tubulin was used as a loading control. P1, P2 and Mβ, are the full-length, glycosylated ER form and processed PMEL forms. *non-specific band. Relative protein band intensities were quantified and are indicated on the gels.

