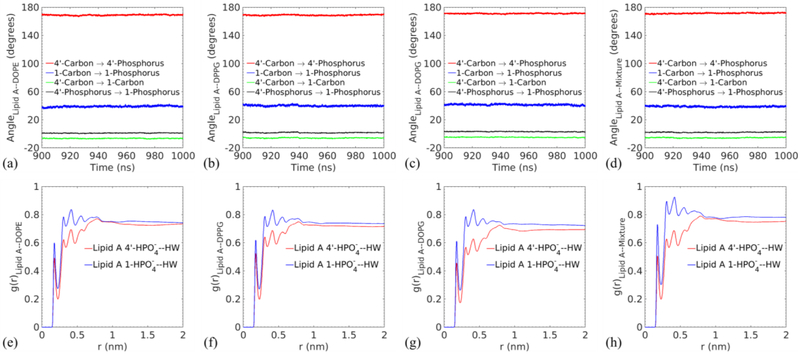
Fig. 10.
Top panel: time variations in the angle between the selected vectors and the membrane surface for (a) Lipid A–DOPE, (b) Lipid A–DPPG, (c) Lipid A–DOPG, and (d) Lipid A–Mixture membranes. The legends indicate the vectors whose directions are defined by linking the position of the first atom to the second atom. Bottom panel: radial distribution functions between the 1 and 4’ position phosphate groups in Lipid A and the hydrogen atom of water in each membrane (e-h) corresponds to (a-d), respectively.

