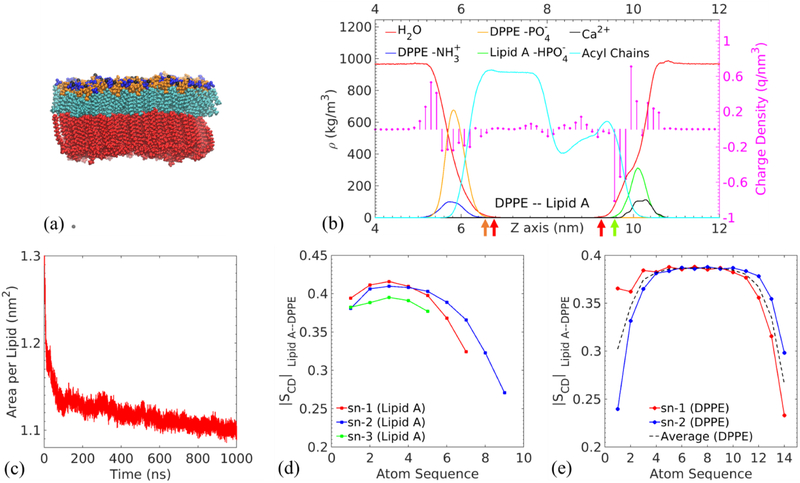
Fig. 2.
Lipid A–DPPE membrane as the benchmark: (a) representative snapshot of an equilibrated membrane. The color scheme of Lipid A functional groups is the same as in Fig. 1. Black atoms represent calcium ions. DPPE phospholipid molecules are colored in red. (b) Mass density ρ (continuous lines) and charge density (circles terminating each stem) profiles of the selected functional groups along the direction normal to the membrane (the z direction). The values are averaged over the last 100 ns of the MD simulations. The left part of the figure represents the DPPE leaflet and the right corresponds to the Lipid A leaflet. (c) Area per lipid of Lipid A molecules. Carbon-deuterium order parameters of (d) sn-1, sn-2 and sn-3 acyl chains of Lipid A and (e) sn-1 and sn-2 acyl chains of DPPE.

