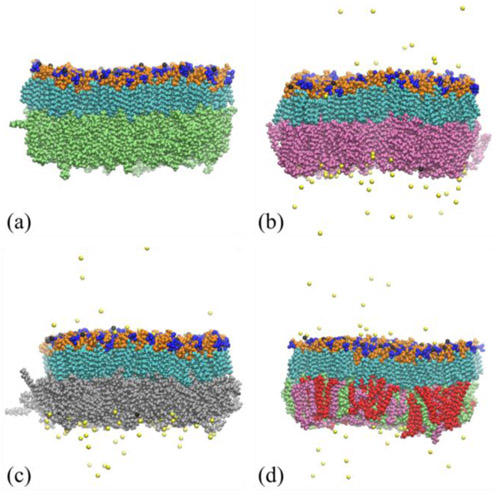
Fig. 3.
Representative snapshots of four Lipid A–phospholipid asymmetric bilayer membranes at equilibrium, including: (a) Lipid A–DOPE, (b) Lipid A–DPPG, (c) Lipid A–DOPG, and (d) Lipid A–Mixture membranes. The color scheme of Lipid A functional groups is the same as in Fig. 1. Black and yellow atoms respectively represent calcium and sodium ions. DPPE, DOPE, DPPG, DOPG molecules are colored in red, green, purple, and silver, respectively.

