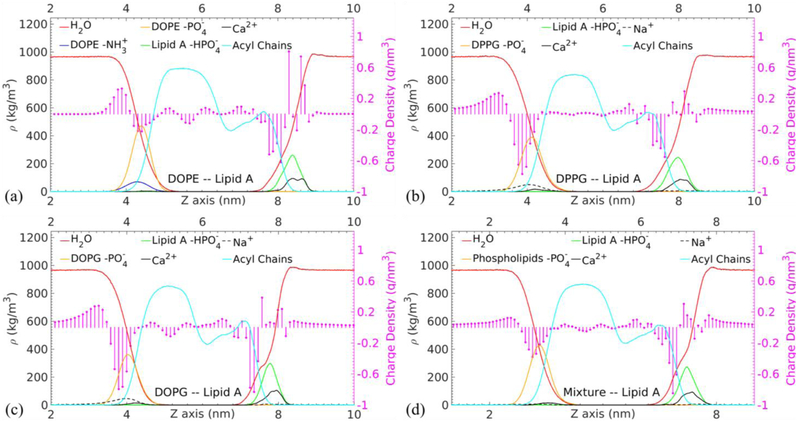
Fig. 5.
Mass density ρ profiles of the selected functional groups and total charge density ρc profiles in circles terminating each stem along the membrane normal direction (the z axis) for the selected functional groups in the (a) Lipid A–DOPE, (b) Lipid A–DPPG, (c) Lipid A–DOPG, and (d) Lipid A–Mixture membranes. The values are averaged over the last 100 ns of the MD simulations.

