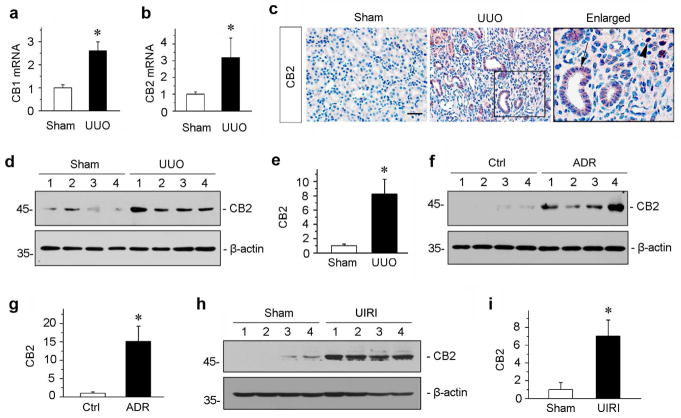
Figure 1.
Renal expression of CB2 is induced in various models of CKD. (a, b) Quantitative real-time RT-PCR (qRT-PCR) showed the relative abundances of CB1 (a) and CB2 (b) mRNA in sham and UUO kidneys at 7 days after UUO. *P < 0.05 versus sham controls (n = 5 to 6). (c) Immunohistochemical staining demonstrated CB2 protein expression and localization in the obstructed kidneys at 7 days after UUO. Paraffin-embedded kidney sections were stained with CB2 antibody. Boxed area was enlarged. Arrow indicates positive tubular staining. Arrowhead denotes interstitial cells stained positively for CB2. Scale bar, 50 μm. (d, e) Western blotting analyses showed the renal expressions of CB2 protein in the obstructed kidneys at 7 days after UUO. Representative Western blot (d) and quantitative data (e) are presented. Numbers (1 ~ 4) indicate each individual animal in a given group. Relative CB2 levels (sham controls = 1.0) were presented after normalization with actin. *P < 0.05 versus sham controls (n = 5 to 6). (f, g) Renal CB2 expression is induced in adriamycin (ADR) nephropathy. CB2 expression was assessed in the kidneys at 3 weeks after ADR injection. Representative Western blot (f) and quantitative data (g) are presented. Numbers (1 ~ 4) indicate each individual animal in a given group. Relative CB2 levels (controls = 1.0) were presented after normalization with actin. *P < 0.05 versus controls (n = 5 to 6). (h, i) Western blotting analyses demonstrated renal CB2 expression at 11 days after ischemia/reperfusion injury (IRI). Representative Western blot (h) and quantitative data (i) are presented. Numbers (1 ~ 4) indicate each individual animal in a given group. Relative CB2 levels (sham controls = 1.0) were presented after normalization with actin. *P < 0.05 versus controls (n = 5).

