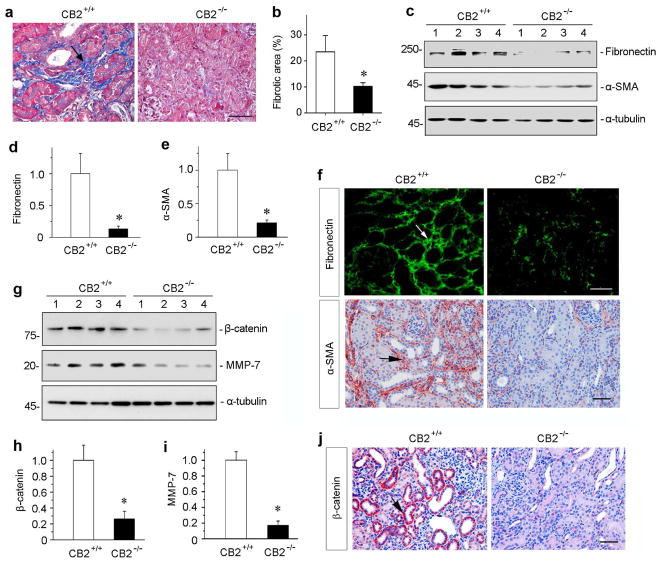
Figure 4.
Mice with CB2 deficiency are protected against renal fibrosis after obstructive injury. (a) Representative micrographs show Masson’s trichrome staining (MTS) of the obstructed kidneys in CB2 null mice (CB2−/−) and wild-type controls (CB2+/+) at 7 days after UUO. Blue staining (arrow) indicates fibrotic collagen deposition. Scale bar, 50 μm. (b) Quantitative determination of the fibrotic area in CB2−/−null mice and CB2+/+ wild-type controls at 7 days after UUO. *P < 0.05 versus CB2+/+ group (n = 5 to 6). (c) Western blot analyses show that ablation of CB2 reduced renal expression of fibronectin and α-SMA after UUO. Numbers (1 to 4) represent different individual animals in a given group. (d, e) Graphic presentations of relative renal fibronectin (d) and α-SMA (e) protein levels in two groups as indicated. *P < 0.05 versus CB2+/+ group. (f) Immunostaining for renal fibronectin and α-SMA proteins in CB2+/+ and CB2+/+ mice as indicated. Frozen sections and paraffin sections were stained with different antibodies against fibronectin and α-SMA, respectively. Arrow indicates positive staining. Scale bar, 50 μm. (g) Western blot analyses show renal expression of β-catenin and its downstream MMP-7 after UUO. Numbers (1 to 4) represent different individual animals in a given group. (h, i) Graphic presentations of renal β-catenin (h) and MMP-7 (i) expressions in two groups as indicated. *P < 0.05 versus CB2+/+ mice. (j) Immunostaining for renal β-catenin proteins in CB2+/+ and CB2+/+ mice as indicated. Arrow indicates positive staining. Scale bar, 50 μm.

