

Abstract
Uveal melanoma (UM) is the most common primary intraocular cancer and has a high incidence of metastasis, which lacks any effective treatment. Here we present zebrafish models of UM, which are driven by melanocyte-specific expression of activating GNAQ or GNA11 alleles, GNAQ/11Q209L, the predominant initiating mutations for human UM. When combined with mutant tp53, GNAQ/11Q209L transgenics develop various melanocytic tumors, including UM, with near complete penetrance. These tumors display nuclear YAP localization, and thus phenocopy human UM. We show that GNAQ/11Q209L expression induces profound melanocyte defects independent of tp53 mutation, which are apparent within 3 days of development. First, increases in melanocyte number, melanin content, and subcellular melanin distribution result in hyperpigmentation. Additionally, altered melanocyte migration, survival properties, and evasion of normal boundary cues lead to aberrant melanocyte localization and stripe patterning. Collectively, these data show that GNAQ/11Q209L is sufficient to induce numerous pro-tumorigenic changes within melanocytes.
Keywords: uveal melanoma, GNAQ, GNA11, zebrafish, melanophore, melanocyte
Significance
Uveal melanoma (UM) is the most common intraocular tumor. Although effective treatments exist for the primary tumor, approximately 50% of UM patients develop lethal metastases for which there is currently no therapy. The vast majority of UM is initiated by constitutively active GNAQ or GNA11 proteins. While downstream effectors have been identified, the impact of these changes on melanocytes is largely unknown. Using a zebrafish model of GNAQ/11Q209L-driven UM, we demonstrate that oncogenic GNAQ/11 causes rapid and profound changes in melanocyte biology, including alterations in proliferation, migration, and survival, which occur well before acquisition of the transformed state.
Introduction
Uveal melanoma (UM) is the most common adult primary intraocular tumor, with about 2000 new cases in the US each year (Jovanovic and Vlajkovic 2013). It is a highly aggressive cancer and 50% of patients present with metastases within 15 years of diagnosis. There is no effective treatment for the metastatic disease, and the median survival following diagnosis is just 6 months (Shoushtari and Carvajal 2016). Thus, there exists an urgent need to understand UM biology and develop effective therapeutic strategies.
UM arises from non-classical melanocytes residing in the choroid, iris and ciliary body (Shoushtari and Carvajal 2014). Despite their shared melanocytic origin, different initiating mutational events drive UM and cutaneous melanoma. Most cutaneous melanomas carry oncogenic mutations in B-RAF or N-RAS, but these are rarely observed in UM (Rimoldi 2003). Instead, more than 80% of UM cases have gain-of-function mutations in GNAQ or GNA11 (Onken et al. 2008; Van Raamsdonk et al. 2010). These genes (herein referred to as GNAQ/11) encode proteins that are 90% homologous at the amino acid level, and serve as α-subunits of a heterotrimeric G-protein receptor (GPCR) complex. The most common GNAQ/11 mutations in UM create substitutions at Q209 or R183 of the Ras-like GTPase domain that result in constitutive activation (reviewed in Shoushtari and Carvajal 2014). Cellular studies showed that GNAQ/11 signal to numerous downstream effectors. They activate the MAPK/MEK/ERK cascade and phospholipase C (PLCβ), which can transduce signals to protein kinase C (Van Raamsdonk et al. 2009; Wu et al. 2012). More recently, oncogenic GNAQ/11Q209L was shown to activate YAP signaling via a HIPPO-independent pathway (Feng et al. 2014; Yu et al. 2014) and also the ARF6-β-catenin pathway (Yoo et al. 2016). Despite these advances in our understanding of the molecular consequences of oncogenic GNAQ/11 signaling in UM cell lines and xenograft/tumor models, we still know relatively little about its impact on the fundamental biology of the melanocyte.
Due to the strong conservation of melanocyte differentiation programs between zebrafish and amniotes (Mort, Jackson, and Patton 2015), the study of zebrafish pigment mutants has made significant contributions to our understanding of this biology (Kelsh et al. 2009; Singh and Nusslein-Volhard 2015). The canonical striped pigment pattern of zebrafish is generated by the appropriate development, interactions and localization of the three different chromatophores, or pigment cells: melanophores (herein referred to as melanocytes), xanthophores, and iridophores (Parichy and Spiewak 2015). Existing zebrafish pigment mutants fall into two general subclasses. The first subclass displays defects in chromatophore development, and their study has yielded key insight into the differentiation, maintenance, survival, proliferation and migration of melanocytes and their progenitors. The second subclass displays adult stripe pattern defects resulting from alterations in signaling pathways and cell-cell interactions. This second class includes zebrafish mutants defective in background adaptation, a process by which the melanin granules disperse or contract within the melanocyte in response to adrenergic or hormonal cues to camouflage the fish in different surroundings (Logan et al. 2006).
The zebrafish has also been validated as an excellent system to model cancer (White, Rose, and Zon 2013). Mutation of numerous oncogenes and tumor suppressor genes yields the appropriate tissue tumor type in zebrafish. A recent study showed that melanocyte-specific expression of GNAQQ209P, in combination with inactivation of the tp53 tumor suppressor, results in development of UM (Mouti et al. 2016). We have generated a similar zebrafish model of UM that is driven by the expression of GNAQQ209L or GNA11Q209L, and have used this to determine how GNAQ/11Q209L modulates melanocyte biology. Our data reveal that GNAQ/11Q209L causes profound pigmentation defects that result from changes in numerous pro-tumorigenic processes, including proliferation, survival, signaling and migration.
Results
Melanocyte-specific expression of oncogenic GNAQ/11Q209L yields profound pigmentation defects
We integrated human GNAQQ209 or GNA11Q209L tumor alleles into the zebrafish genome under the control of the melanocyte-specific promoter, mitfa, using Tol2-directed transgenesis (Figure 1A). The resulting chimeric zebrafish displayed patches of hyperpigmentation providing early evidence that expression of GNAQ/11Q209L alters melanocyte biology (Figure S1). We observed germline transmission from numerous GNAQQ209L and GNA11Q209L chimeras, and further breeding and analyses yielded three Tg(mitfa:GNAQQ209L) and four Tg(mitfa:GNA11Q209L) stable independent transgenic lines (generically referred to as Tg+) with single copy insertions (data not shown). We identified the insertion site for Q-1 (the transgenic line used most in this study) and established that it lies in an intergenic region 2 kb downstream of pfn1 and 7 kb upstream of eno3 on Chromosome 23.
Figure 1.
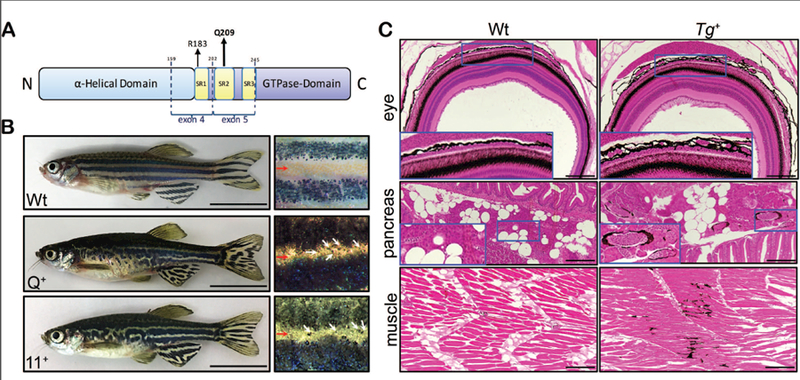
Melanocyte specific expression of GNAQ/11Q209L yields pigmentation defects. (A) Schematic of domains and sites for oncogenic mutation in GNAQ/11. (B) Relative to wild type controls (Wt), adult Tg(mitfa:GNAQQ209L) and Tg(mitfa:GNA11Q209L) zebrafish display hyperpigmented skin with disorganized stripes (left) and melanocytes (white arrows) in the interstripe (red arrow) region (right). Scale bar= 1 cm. (C) Tg+ zebrafish display thickening of the pigmented choroid layer, hyperpigmentation around blood vessels, and pigmentation in the musculature. Scale bar= 100μm.
All adult Tg+ zebrafish displayed visible pigmentation defects typified by hyperpigmentation and abnormal, nonlinear stripes (Figure 1B). Additionally, histological analyses revealed internal pigment defects in Tg+ animals (Figure 1C). Most importantly, in a partially penetrant manner we detected thickening of the choroid, but never the retinal pigmented epithelium (RPE). Moreover, various internal tissues displayed abnormal pigmentation. This included the frequent presence of rings of hyperpigmentation around blood vessels (Figure 1C) or organs (Figure S2), and also regions of pigment within the musculature, which occurred rarely, if ever, in wild type clutchmate controls (Figure 1C). Thus, GNAQ/11Q209L expression is sufficient to modulate melanocyte biology in vivo.
Oncogenic GNAQ/11Q209L cooperates with tp53 mutation to generate aggressive pigmented tumors that resemble human UM
We aged all seven GNAQ/11Q209L zebrafish lines and found that Tg+ fish developed melanotic tumors at very low incidence and with long latency (>18 months; data not shown). This was anticipated, as human UM requires cooperating mutations. Thus, we crossed GNAQ/11Q209L Tg+ lines with fish carrying a mutation in the tp53 tumor suppressor, tp53M214K, which develop malignant nerve sheath tumors (MPNST) but not melanoma (Berghmans et al. 2005). We then generated and aged cohorts of fish that were Tg- or Tg+ and either heterozygous or homozygous for tp53M214K (Figure 2A,B). The addition of Tg+ alleles to both tp53M214K/M214K and tp53M214K/+ backgrounds resulted in reduced lifespans (Figures 2A, 2B, S3) and altered tumor spectrum (discussed below). The reduction in lifespan varied for individual Tg+ alleles, but was statistically significant for six of the seven Tg(mitfa:GNAQ/11Q209L);tp53M214K/M214K lines relative to their tp53M214K/M214K clutchmate controls (Figure 2B; p<0.0001). The variation in Tg+ effects was highly consistent from one generation to the next (Figure S3A,B) and covered a similar range for both GNAQ and GNA11 mutant lines (compare red/orange versus blue curves in Figure 2B). This finding, together with the other shared phenotypes of our Tg+ lines (see below), fits with the synonymous roles of GNAQQ209L and GNA11Q209L in human UM. Moreover, the general consistency in phenotypes across our seven transgenic lines provides strong confidence that they truly result from the tissue-specific expression of the GNAQ/11Q209L oncogenes, rather than being a positional effect of the transgenic insert.
Figure 2.
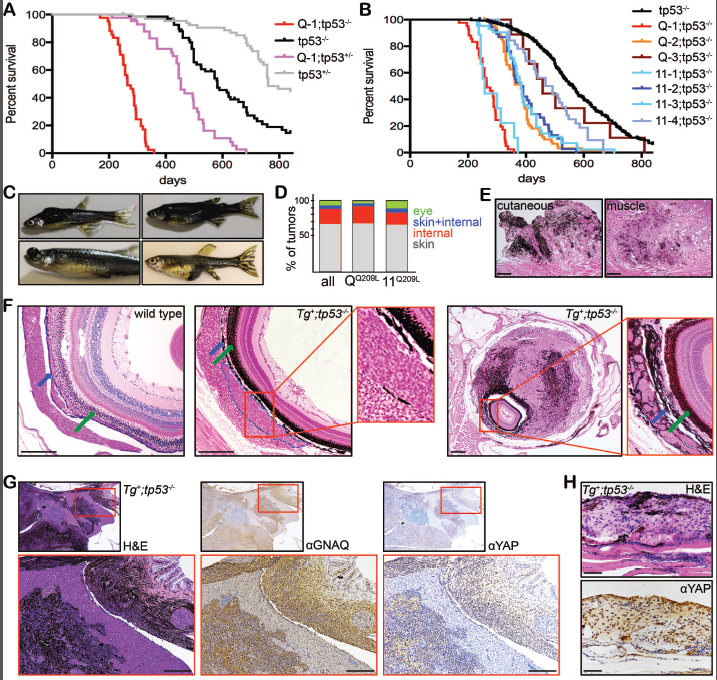
Oncogenic GNAQ/11, in combination with tp53M214K mutation, yields lethal melanotic tumors. (A-B) Kaplan-Meier (KM) curves for zebrafish carrying tp53M214K mutant alleles (shown as tp53+/− or tp53/-- for brevity) alone or in combination with (A) the Tg(mitfa:GNAQQ209L) Q-1 allele, or (B) several different mitfa:GNAQQ209L (red and orange lines) or mitfa:GNA11Q209L (blue lines). For (B) the black tp53−/− line shows the combined tp53−/− controls. For all transgenes, p<0.0001 by logrank test when compared to appropriate tp53−/− control, except for Q-3, where p=0.2133. (C) Representative images of Tg(mitfa:GNAQ/11Q209L);tp53−/− zebrafish with cutaneous, eye, and internal tumors. (D) Distribution of tumor locations in Tg(mitfa:GNAQ/11Q209L);tp53−/− zebrafish. (E-F) Representative H&E stained sections of: (E) a cutaneous melanoma (left) and a melanized tumor in muscle (right); and (F) eyes from wild type fish (left panel) and Tg+;tp53−/− fish with an emerging choroidal tumor (middle panel, marked in blue outline) or an advanced stage UM (right panel). Arrows indicate the choroid (blue arrow) and RPE (green arrow) layers. Scale bars = 100μm. (G-H) H&E and IHC staining for the indicated proteins in sequential sections from (G) an internal melanotic tumor (scale bar = 200 μm) or (H) a cutaneous melanoma (scale bar = 50 μm), establishing that both display nuclear YAP.
Importantly, the lifespan shortening effect of the Tg+ alleles accompanied a profound switch in tumor phenotype; the Tg-;tp53 mutant clutchmate controls developed predominantly MPNST and never melanoma, while the Tg+;tp53 mutants developed melanotic tumors with near complete penetrance. These melanotic tumors were highly heterogeneous, typically including both pigmented regions and unpigmented areas suggestive of a poorly differentiated state (Figures 2C-F, S4). They were also extremely aggressive, with regard to both speed of growth and ability to invade into surrounding tissues. Notably, these tumors initiated in various locations (Figure 2D). The most prevalent was cutaneous melanoma (Figure 2C-E), which is consistent with the existence of GNAQ/11Q209L mutations within a small fraction of human cutaneous melanomas (Van Raamsdonk et al. 2009; Johnson et al. 2016), and the fact that the vast majority of fish melanocytes are present in the skin. Other melanotic tumors arose from internal sites (Figures 2C-E, S4). Since we see abnormal internal pigmentation within the Tg+ zebrafish (Figure 1C), we hypothesize that these are primary tumors, which arise from inappropriately positioned, internal melanocytes. Most importantly, the Tg+;tp53M214K/M214K and Tg+;tp53M214K/+ zebrafish displayed ocular tumors (Figure 2C,D,F). Analysis of H&E-stained sections show that these clearly emerge from the choroid layer (Figure 2F) and their histology closely resembled human UM (personal communication, Dr. Rebecca Stacy, Massachusetts Eye and Ear Infirmary). Tumors arising in the Tg+;tp53M214K/+ zebrafish displayed loss of heterozygosity for tp53 (as judged by analysis of tumor versus fin DNA, data not shown), confirming the need for cooperating mutations in Tg+ driven tumors.
To validate whether the GNAQ/11Q209L-driven tumors recapitulate aspects of human UM, we screened sections from both ocular (n=4) and internally-arising (n=14) melanotic tumors, for UM-relevant events. An antibody that recognizes human, but not zebrafish, GNAQ consistently stained the tumor cells, with some cell-to-cell variation, with little or no signal from adjacent normal tissues (Figures 2G, S5). We then screened for nuclear YAP, a downstream effector that is a distinguishing hallmark of human UM driven by GNAQ/11 mutations, but not the much rarer BRAF or NRAS mutations (Yu et al. 2014), and observed positive nuclear YAP staining within uveal, cutaneous and internal melanotic tumors, but not surrounding healthy zebrafish tissue (Figure 2H and S5). The strength of nuclear YAP staining was also heterogeneous, and typically correlated with the strength of the GNAQ signal (Figure S5). Thus, irrespective of their origin, our oncogenic GNAQ-driven melanomas phenocopy core molecular features of human GNAQ/11Q209L-driven UM.
Tg(mitfa:GNAQ/11Q209L) zebrafish display pigmentation defects throughout development
We then used this model to establish how oncogenic GNAQ/11Q209L expression alters the melanocyte biology prior to the development of tumors. We began by investigating onset and progression of the Tg+ pigmentation defects. Notably, adult zebrafish melanocytes arise from an intermediate neural crest-derived stem cell population located by the dorsal root ganglia, whilst their embryonic counterparts are derived directly from the neural crest (reviewed in Parichy and Spiewak 2015). Thus, we first asked whether the pigment defects we observed in adult Tg+ zebrafish, also exist in embryos. We generated cohorts of Wt and Tg+ clutchmates from representative GNAQ and GNA11 mutant lines (Q-1 and 11–4) and followed them through development. As early as 3 days post-fertilization (dpf), pigmentation differences were apparent between Wt and Tg+ clutchmates (Figures 3A, S6A). At 3 dpf, Wt embryos had dorsal and ventral melanocyte stripes, and also an ordered lateral stripe across the horizontal myoseptum (Figure 3A), and by 3.5 dpf most Wt melanocytes had migrated off the yolk sac to join the ventral stripe (Video S1). In contrast, 3 dpf Tg+ zebrafish possessed a disordered melanocyte lateral stripe and were hyperpigmented (Figure 3A). Moreover, at 3.5 dpf, they clearly maintained melanocyte localization over the yolk sac (Fig. 3A, Video S2).
Figure 3.
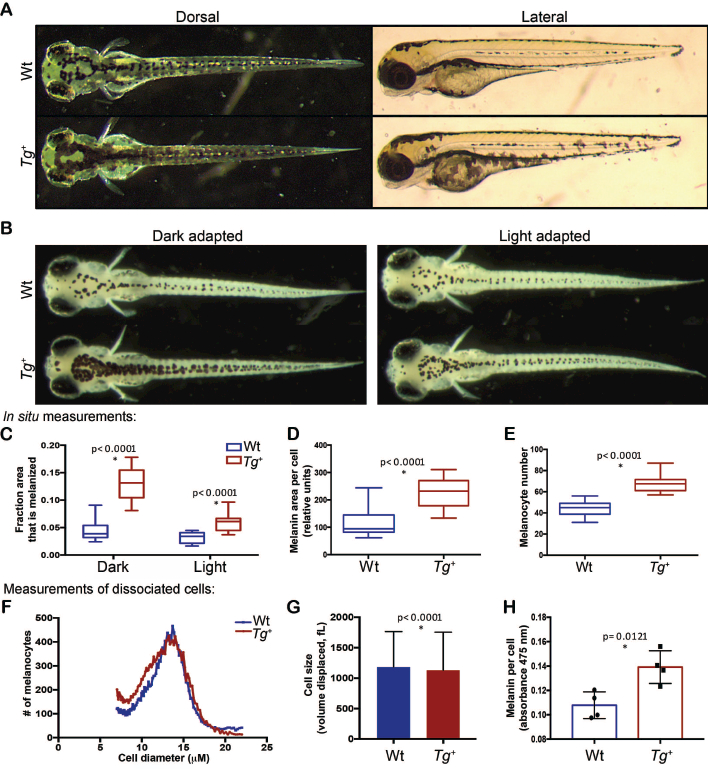
Oncogenic GNAQ/11 disrupts melanocyte biology at both the organismal and cellular level. (A) At 3.5 dpf, line Q-1 Tg+ embryos are hyperpigmented and display melanocyte localization and boundary defects compared to Wt controls. (B-C) After either light or dark background adaption from 4–5 dpf, Tg+ embryonic fish display greater melanin coverage than Wt clutchmate. For quantification (C), we examined a defined section of the dorsal surface and measured the fraction that was melanized, n=40–45 fish per condition/genotype, p<0.0001 by 2-way ANOVA. (D-E) Compared to Wt controls, Tg+ fish have: (D) a higher area of melanin coverage per melanocyte at 5 dpf as measured in situ after dark adaption; and (E) a greater total number of melanocytes at 5 dpf as counted in situ following light-adaption. For D-E, n=21 or 22 per genotype, p<0.0001 by 2-tailed T-test with Welch’s correction. (F-G) Size of Wt (n=18,043) and Tg+ (20,934) melanocytes purified from 5 dpf embryos was measured by Coulter counter. Data are displayed as both: (F) distribution of cell diameters; and (G) mean volume displaced ± SD (Tg+ mean=1,131fL, Wt mean=1,184fL, p<0.0001 by unpaired t-test). (H) Melanin concentration in lysates of purified Wt and Tg+ melanocytes from 5 dpf embryos, as measured by absorbance at 475nm and normalized to cell number. p=0.0121 by 2-tailed T-test with Welch’s correction; n=4 experiments, with total n=2,540 (Wt) and 1,624 (Tg+) zebrafish.
The pigment defects became more pronounced at other key developmental stages including late embryogenesis, metamorphosis (the transition from the embryonic to adult pigment patterns), and juvenile and adult stages, where they extended into the fins (Figure S6B); the hyperpigmentation became exacerbated and stripe patterns were increasingly disorganized. In addition, both metamorphic and adult Tg+ zebrafish displayed numerous melanocytes that were inappropriately localized within the interstripe region (Figures 1B, S6A). This mislocalization is not limited to the interstripe region, as evidenced by abnormal pigmentation at internal sites within adult Tg+ fish (Figures 1C, S2). Importantly, we observed a similar spectrum and time of onset for pigment defects in both the GNAQ (Q-1) and GNA11 (11–4) mutant lines (Figure S6A), indicating that they are consistent and robust consequences of oncogenic GNAQ/11Q209L expression.
Our analyses further revealed a qualitative difference in melanin dispersion in Tg+ compared to Wt melanocytes; the melanin appeared punctate and aggregated in the Wt melanocytes, but had a more dispersed phenotype in the Tg+ clutchmates (Figure 3A). We took advantage of background adaption, the process by which melanosomes are dispersed or contracted in response to dark or light conditions, to assess and quantify additional melanocyte phenotypes in Tg+ embryonic zebrafish (Figure 3B). We examined the degree of hyperpigmentation in 5 dpf embryonic fish that had been either dark or light adapted, and showed that the Tg+ zebrafish had a higher percentage of total area covered in melanin than their Tg+ clutchmate controls under both conditions (Figure 3B,C; p<0.0001). Notably, this increased coverage resulted from two distinct changes. First, the area of melanin coverage per melanocyte was substantially increased in Tg+ fish as quantitated under dark adaption conditions to measure melanocytes in the melanin-expanded state (Figure 3D; p<0.0001). Second, the Tg+ fish had significantly more melanocytes, as judged by quantification of their melanin puncta (resulting from clustered melanosomes) in light-adapted fish (Figure 3E; p>0.0001). Importantly, these phenotypes were all tp53-independent (Figure S7).
Having shown that transgene expression expands the per-cell melanin coverage, we wished to determine whether this results from altered intracellular distribution of melanin and/or an increase in cell size. To address this question, we purified melanocytes from Wt versus Tg+ embryos and assessed cell size by using a Coulter counter to measure volume displacement. The Wt and Tg+ melanocytes showed a highly similar distribution of sizes (Figure 3F), with the Tg+ cells showing a slight shift towards smaller mean size (Figure 3G; Tg+ mean=1,131fL, Wt mean=1,184fL, p<0.0001) that was statistically significant because of the large sample size. In parallel, we addressed whether an increased melanin content per melanocyte contributed to the hyperpigmentation phenotype. By isolating Wt and Tg+ melanocytes from 5 dpf fish, and measuring absorbance at 475nm of the lysed cells, we determined Tg+ melanocytes had a significantly higher melanin concentration (Figure 3H; p=0.0121). Therefore, oncogenic GNAQ expands the per cell melanin coverage by increasing the melanin content of the cells without increasing cell size.
Tg(mitfa:GNAQQ209L) expressing melanocytes have increased survival capacity in vivo and in vitro
Normal melanocytes are known to undergo apoptosis if they persist in the interstripe regions (Singh and Nusslein-Volhard 2015). Since we consistently observed Tg+ melanocytes within interstripe regions (Figure 1), we hypothesized that oncogenic GNAQ signaling was promoting their survival. To assess survival in the in vivo setting, we followed fish through metamorphosis, during which apoptosis plays a well-defined role as part of the transition from embryonic to adult pigmentation (Kelsh et al. 2009). In normal metamorphosis, xanthophores accumulate in the embryonic stripe region along the horizontal myoseptum, while metamorphic melanocytes populate the ventral myotomes (Kelsh et al. 2009). Embryonic and early metamorphic melanocytes can initially survive in the developing xanthophore interstripe, but are ultimately forced by cues from interstripe xanthophores to migrate into the early adult stripes or die in situ. We followed Wt and Tg+ zebrafish through metamorphosis and into adulthood (14dpf-44dpf) and quantified the accumulation and persistence of melanocytes in the interstripe region (Figure 4A,B). This revealed increased numbers of Tg+ melanocytes in the xanthophore interstripe at all time points that were statistically significant from 18 dpf on (Figure 4B; p<0.001). The discrepancy between Wt and Tg+ became greater over time, establishing a sustained persistence of Tg+ melanocytes.
Figure 4.

Tg+ expression confers enhanced survival to melanocytes in vivo and in vitro. (A-B) Wt and Tg+ zebrafish were followed through metamorphosis and analyzed at representative times. (A) At all stages, Tg+ zebrafish have many more melanocytes, which are both broadly disrupted across both the flanks and the interstripe region (white arrows). Scale bar = 1mm. (B) Quantification shows that melanocytes persist on the interstripe regions, indicating a failure to apoptose. n=9 (Wt), 11 (Tg+) zebrafish ***p<0.0001, **p=0.0002, *p=0.0271 as calculated by unpaired t-test. (C) Representative images (10x) and (D) quantification of Wt and Tg+ melanocytes at indicated times after in vitro plating reveals a significant difference in survival. p-value close to zero using the Generalized Estimation Equation (GEE) with link function of Poisson distribution, n=9 experiments.
To complement this in vivo analysis, we isolated Wt and Tg+ melanocytes from adult fins and directly compared their survival in vitro. As melanocytes are heavily pigmented, we could not follow cell number by traditional trypan-blue exclusion assays. Instead, we counted the live cells present in 4 random fields per well from Day 1 until Day 7 post-seeding (Figure 4C,D). Counts were averaged over each well and normalized to Day 1 counts. Importantly, our time-lapse imaging studies (data not shown) established that the Wt and Tg+ melanocytes did not proliferate in culture and thus the observed cell number directly reflected in vitro survival. Melanocyte survival declines drastically in both genotypes from Day 1 to Day 2, but after this initial phase the Tg+ melanocytes displayed improved in vitro survival compared to the Wt controls [Figure 4D; p-value close to zero using the Generalized Estimation Equation (GEE) with link function of Poisson distribution]. This enhanced survival was particularly apparent at later time points, mirroring the increased interstripe persistence of Tg+ melanocytes in vivo. Thus, transgene expression enhances melanocyte survival in vitro and in vivo.
Tg(mitfa:GNAQQ209L) expression in melanocytes results in altered morphology and increased motility
We next examined other properties of cultured Wt versus Tg+ melanocytes. Consistent with the in vivo phenotype (Figure 5A), seeded Tg+ melanocytes appeared more dendritic than the Wt controls. We quantified dendricity by calculating cell convexity, which is the ratio of the convex hull perimeter (the smallest polygon that can be drawn around the cell) to the cell perimeter (a trace of the cell outline) as shown in Figure 5B. This established that the two genotypes had a highly significant difference in mean convexity (p<0.0001), with both the mean and minimal convexity being considerably lower in Tg+ melanocytes (Figure 5B). Time-lapse video microscopy of these plated melanocytes revealed that the morphology of the Tg+ melanocytes was highly dynamic, switching back and forth between highly dendritic and rounded states (Figure 5C). In contrast, Wt melanocytes maintained a more rounded state while expanding and contracting the melanin within their cell boundaries (Figure 5C).
Figure 5.

Tg+ expressing melanocytes are more dendritic, more motile, but have worse persistence than Wt controls. (A) Images of Wt and Tg+ melanocytes (upper panel) above the first stripe in vivo or (lower panel) isolated from adult fins and plated on collagen in vitro, show increased dendricity of Tg+ cells. Scale bar = 100μm (B) Quantitation of dendricity in vitro, as measured by convexity. p<0.0001 by 2-tailed t-test with Welch’s correction; n=79 (Wt), 130 (Tg+). (C-D) Analysis of Wt and Tg+ melanocytes in vitro using time-lapse microscopy. (C) Time-lapse images show representative alterations in morphology of individual Wt (upper) and Tg+ (lower) between 0:00 and 9:00 hours. Scale bar = 25μm. (D-F) The migration paths of individual Wt and Tg+ melanocytes (n=10 each) observed within representative image fields were tracked over 24 hours. (D) Plots are presented with scales of 200μm to highlight distance traveled (upper panels), and 75μm to highlight persistence (lower panels). (E, F) Quantitation of 0–12, 0–24 and 0–36 hr time windows from a representative experiment (n=25 Wt and 38 Tg+) with p values calculated by 2-way ANOVA with Bonferroni’s correction of: (E) total distance traveled; p<0.0001; and (F) persistence (measured by distance migrated over total path length); p<0.0001 at 12 and 24 hrs and p=0.002 at 36 hrs. Experiments were repeated multiple times, yielding similar results.
We extended these studies to compare motility of Wt versus Tg+ melanocytes. We plated isolated melanocytes in serum-free media overnight and brought it up to 10% FBS before time-lapse imaging. This revealed striking differences in the migratory behavior of Wt and Tg+ melanocytes (Videos S3 (Wt) and S4 (Tg+). We compared the migratory tracks of individual Wt and Tg+ melanocytes for 0–12, 0–24, and 0–36 time windows and observed two critical differences in each case. First, quantitation of the total path length (total distance traveled) established that Tg+ melanocytes had traveled significantly greater distances than their Wt control counterparts over the 24 hr period (Figure 5D,E; p<0.0001). Second, despite this enhanced migratory ability, the Tg+ melanocytes displayed significantly reduced persistence (calculated as the distance between the starting and ending location of the melanocyte divided by the total distance traveled) for the 0–12 hr (p<0.0001), 0–24 hr (p<0.0001) and 0–36 hr (p=0.002) time windows (Figure 5D,F). Thus, collectively, these in vitro analyses establish that oncogenic GNAQ causes striking changes in the survival, morphology and migratory persistence that are highly consistent with the in vivo phenotypes of the Tg+ melanocytes.
Discussion
We have generated a zebrafish model of UM through the melanocytic expression of human UM driver mutations, GNAQQ209L and GNA11Q209L. When expressed alone, these yield tumors with poor penetrance and very late onset, consistent with the known need for co-operating mutations in human UM (Ewens et al. 2014). When combined with tp53M214K/M214K mutations, oncogenic GNAQ/11Q209L yields uveal melanomas, with similar morphology to human UM, and other aggressive, melanotic tumors originating from cutaneous or internal melanocytes. Regardless of the initiating location, these zebrafish tumors express high levels of the driving oncogene, and also nuclear YAP, a hallmark of human UM, indicating that they recapitulate the human malignancy. Our analysis of the transgenic zebrafish has provided key insight into the effects of GNAQ/11Q209L on melanocyte biology, revealing profound pigment defects, including hyperpigmentation and aberrant morphology and localization, which are apparent by 3 dpf and become more exaggerated over time. Our combined in vivo and in vitro analyses show that these reflect alterations in a diverse range of cellular processes, including motility, proliferation and survival, which are all potentially pro-tumorigenic.
Our study is the first to extensively characterize the effects of an oncogene on stripe patterning. Previous studies have shown that zebrafish melanocytes arise from distinct stem cell populations in embryonic versus adult stages, and in the body versus the fins (Budi et al. 2008; Parichy and Spiewak 2015). Since the transgenes affect both cutaneous and fin patterns at all development stages, we conclude that oncogenic GNAQ/11 signaling impacts the melanocytes arising from all stem cell/progenitor populations. At one level, this finding is unsurprising, since the mitfa-promoter functions during both embryonic and adult stages. Nevertheless, it shows that oncogenic GNAQ/11 signaling has widespread effects, in contrast to other signaling pathways that can be stage-specific. Furthermore, the GNAQ/11Q209L transgenics clearly belong in both of the general subclasses of pigmentation mutants; they disrupt melanocyte development and also their response to environmental cues, which establish the adult stripe pattern (as reviewed in Parichy and Spiewak 2015).
One of the most striking phenotypes of the Tg+ zebrafish is hyperpigmentation. This is due partially to increased levels of melanin with individual melanocytes, which covers a larger area of the cell under both light and dark-adapted conditions. Additionally, oncogenic GNAQ/11 increases the total number of melanocytes. The increased melanocyte numbers are observed in young embryos, well before the known developmental onset of melanocyte apoptosis, strongly suggesting that they result from increased cell proliferation. We also see progressive increases in melanocyte representation in the flanks as the fish progress through the metamorphic and adult stages, suggesting that this continues into adulthood.
Another striking consequence of oncogenic GNAQ expression is the mislocalization of melanocytes in the interstripe regions and also internally. The appropriate localization of zebrafish melanocytes is controlled by a barrage of cues; during metamorphosis, melanocytes in the presumptive interstripe region are subject to repulsive cues from xanthophores and then, if they remain embedded, apoptotic cues from these same cells (Singh and Nusslein-Volhard 2015; Parichy and Spiewak 2015). The persistence of numerous Tg+ melanocytes within the interstripe region of post-metamorphic fish reveals a defective developmental response that includes both a failure to leave the interstripe region appropriately in response to repulsive cues and a subsequent failure to die. Our in vitro analyses of purified Tg+ melanocytes identified two distinct changes that could contribute to this altered behavior. First, we observe a migration defect that reflects increased movement but impaired persistence, which is consistent with the inability of the cells to exit the developing interstripe region. Second, the purified Tg+ melanocytes display increased survival in vitro. Our data do not address the underlying molecular bases for these altered migration and survival properties; these cell autonomous changes could reflect a direct impact of constitutively active GNAQ/11 on the migration and/or apoptotic signaling networks or be a more indirect consequence of incomplete differentiation. Interestingly, observations in other organisms already suggest that oncogenic GNAQ can have opposing, context-dependent effects on cell survival. Specifically, GNAQ expression enhances the survival of human UM cell lines (Posch et al. 2015) but promotes apoptosis of human T-cells (Wang et al. 2014) and murine melanocytes in the interfollicular epidermis (Huang et al. 2015). Cell survival has obvious implications in cancer progression and thus further study of the underlying determinants of the apoptotic response to oncogenic GNAQ/11 signaling will be critical.
We note that the myriad phenotypic consequences of oncogenic GNAQ/11 signaling are clearly apparent within a few days of zebrafish development. Moreover, they occur independent of, and are not enhanced by, tp53 mutation. This is intriguing in two regards. First, while it is easy to see how the observed changes in migratory, survival and proliferative properties might enable tumorigenicity, the rare appearance and late onset of tumors in the Tg+ zebrafish show that these events are clearly insufficient for tumor development. This raises the question of what additional events are contributed by the cooperating mutations. Second, we believe that we can use the Tg+ embryos to conduct screens for drugs and/or genes that modulate the fundamental effects of oncogenic GNAQ/11 signaling, potentially advancing the therapeutic treatment of UM.
Materials and Methods
Zebrafish lines
All zebrafish work was done in accordance with protocols approved by the Committee on Animal Care at MIT. Tg(mitfa:GNAQ/11) transgenics were generated in AB/Tübingen zebrafish (TAB5/14, Amsterdam et al. 1999) as described (Supplemental Methods). All transgenic lines were confirmed to contain single transgene copies by Southern blots. The tp53 mutant line is tp53zdf1 (Berghman et al., 2005).
Tumor phenotype analysis
Fish were PCR genotyped (see Supplemental Methods), and then maintained at similar densities to minimize environmental effects. Zebrafish were euthanized upon signs of ill health, in compliance with CAC-approved protocols. Kaplan-Meier curves were created in Prism. Euthanized fish were fixed, and slides prepared (see Supplemental Methods). After melanin bleaching (see Supplemental Methods) IHC by was conducted by blocking in 5% goat serum, primary antibody incubation overnight at 4°C with anti-YAP (Cell Signaling; #4912) at 1:200 dilution or anti-GNAQ (Abcam; ab75825) at 1:700 dilution; secondary anti-Rb antibody at 1:200 dilution and DAB reaction. Images of H&E or IHC stained slides were taken on a Nikon Eclipse Ds-Ri2 microscope and camera and processed with NIS-elements software V4.3.
Imaging zebrafish
For live imaging, fish were anesthetized in 0.05% tricaine and immobilized in 3% methylcellulose prior to imaging on a backlit stereomicroscope. For background-adaption assays, embryos were raised in a 14hrs on/10hrs off light cycle, and then maintained in petri dishes with white or black matte backgrounds (underneath and at least 1cm around) from 4–5 dpf prior to fixation in 4%PFA. Images were taken with a SPOT insight color camera model 3.2.0 and processed with SPOT image analysis software. Quantitation of melanocyte phenotypes is described in the Supplemental Methods. For in vivo time-lapse movies, embryonic fish (~78hrs post-fertilization) were mounted in 1.2% low melt agarose in fish water. Images were taken at 4X every 20 minutes for 14 hours in a 28°C chamber using a Nikon Eclipse TE3000 microscope with a SPOT-flex model 15.2 camera. Image and movie analysis was performed in FIJI.
Isolation and in vitro culture of melanocytes.
Melanocytes were isolated from adult zebrafish fins essentially as previously reported (Yamanaka, 2014; see Supplemental Methods). For time lapse studies, 24 hours post-plating, the media was changed to L15 with 10% FBS by exchanging one-half existing volume. Cell movement was recorded on a NikonA1R confocal microscope using time-lapse microscopy every 20 minutes for 36 hours in a 29°C chamber. Cell movements from hourly time points were analyzed using the MTrackJ software on ImageJ. Cell morphology was measured by manual tracing at the 10hr still image using FIJI. For cell viability: isolated melanocytes were plated in collagen-coated 96-well plates, and maintained at 28°C in L15. Beginning 24 hours post-seeding, 4 images per well were taken daily at 10X magnification on a Nikon Eclipse TE2000-U microscope using a SPOT-RT3 camera model 25.2. Images were processed using SPOT analysis software. Live cells were counted in the 4 fields as a proxy for cell number. To determine cell volume, melanocytes were isolated from 5 dpf using an alternative protocol (Higdon et al., 2013; see Supplemental Methods), and examined in a hemocytometer to confirm purity (contamination ≤2%, typically xanthophores). Using established protocols (Goranov et al. 2009), melanocytes were counted and sized using a Beckman Coulter Multisizer 3, excluding particles <7fL or >20fL. For determination of melanin content per melanocyte, melanocytes were isolated from 5 dpf embryonic fish using the same method as above (see Supplemental Methods), counted via hemocytometer, and solubilized overnight at 55°C in 1N NaOH/10%DMSO at a volume of 100 cells per μl. Cell lysate was centrifuged at 12,000g for 10 minutes to remove large sediment, and the absorbance of the supernatant was measured at 475 nm.
Supplementary Material
Acknowledgements
We thank Carthage undergraduate students, Benjamin Boren, Tanisha Perlmutter, Josey Muske, and Michael Poplawski, for help in analysis of tail fin pigment phenotypes, and the Koch Institute Swanson Biotechnology Center for technical support, especially the Zebrafish, Histology and Bioinformatics Cores. This work was supported by a Melanoma Research Alliance grant to J.A.L., the Kathy and Curt Marble Cancer Research Fund, the Koch Institute Support (core) Grant P30-CA14051 from the NIH/NCI, and the NIH Pre-Doctoral Training Grant T32GM007287. D.E.P. was a recipient of an MIT School of Science Fellowship in Cancer Research. J.A.L. is the D.K. Ludwig Professor for Cancer Research at the Koch Institute for Integrative Cancer Research.
References
- Berghmans S, Murphey RD, Wienholds E, Neuberg D, Kutok JL, Fletcher CDM, Zon L, and Look AT. 2005. ‘tp53 mutant zebrafish develop malignant peripheral nerve sheath tumors’, PNAS, 102: 407–12. [DOI] [PMC free article] [PubMed] [Google Scholar]
- Budi EH, Patterson LB, and Parichy DM. 2008. ‘Embryonic requirements for ErbB signaling in neural crest development and adult pigment pattern formation’, Development, 135: 2603–14. [DOI] [PMC free article] [PubMed] [Google Scholar]
- Budi EH, Patterson LB, and Parichy DM. 2011. ‘Post-embryonic nerve-associated precursors to adult pigment cells: genetic requirements and dynamics of morphogenesis and differentiation’, PLoS Genet, 7: e1002044. [DOI] [PMC free article] [PubMed] [Google Scholar]
- Ewens KG, Kanetsky PA, Richards-Yutz J, Purrazzella J, Shields CL, Ganguly T, and Ganguly A. 2014. ‘Chromosome 3 Status Combined With BAP1 and EIF1AX Mutation Profiles Are Associated With Metastasis in Uveal Melanoma’, Invest Ophthalmol Vis Sci, 55: 5160–67. [DOI] [PubMed] [Google Scholar]
- Feng X, Degese MS, Iglesias-Bartolome R, Vaque JP, Molinolo AA, Rodrigues M, Zaidi MR, Ksander BR, Merlino G, Sodhi A, Chen Q, and Gutkind JS. 2014. ‘Hippo-independent activation of YAP by the GNAQ uveal melanoma oncogene through a trio-regulated rho GTPase signaling circuitry’, Cancer Cell, 25: 831–45. [DOI] [PMC free article] [PubMed] [Google Scholar]
- Higdon CW, Mitra RD, and Johnson SL. 2013. ‘Gene expression analysis of zebrafish melanocytes, iridophores, and retinal pigmented epithelium reveals indicators of biological function and developmental origin’, PLoS One, 8: e67801. [DOI] [PMC free article] [PubMed] [Google Scholar]
- Huang JL, Urtatiz O, and Van Raamsdonk CD. 2015. ‘Oncogenic G Protein GNAQ Induces Uveal Melanoma and Intravasation in Mice’, Cancer Res, 75: 3384–97. [DOI] [PubMed] [Google Scholar]
- Johnson DB, Roszik J, Shoushtari AN, Eroglu Z, Balko J, Higham C, Puzanov I, Patel SP, Sosman JA, and Woodman SE. 2016. ‘Comparative analysis of the GNAQ, GNA11, SF3B1, and EIF1AX driver mutations in melanoma and across the cancer spectrum’, Pigment Cell Melanoma Res. [DOI] [PMC free article] [PubMed] [Google Scholar]
- Jovanovic P, Mihajlovic M, Djordjevic-Jocic J, and Cekic S, Vlajkovic S, Stefanovic V 2013. ‘Ocular melanoma: an overview of the current status’, Int J Clin Exp Pathol, 6: 1230–44. [PMC free article] [PubMed] [Google Scholar]
- Kelsh RN, Harris ML, Colanesi S, and Erickson CA. 2009. ‘Stripes and belly-spots -- a review of pigment cell morphogenesis in vertebrates’, Semin Cell Dev Biol, 20: 90–104. [DOI] [PMC free article] [PubMed] [Google Scholar]
- Langenau DM, Traver D, Adolfo AF, Kutok JL, Aster JC, Kanki JP, Lin S, Prochownik E, Trede NS, Zon LI, and Look AT. 2003. ‘Myc-Induced T Cell Leukemia in Transgenic Zebrafish’, Science, 299: 887–90. [DOI] [PubMed] [Google Scholar]
- Logan DW, Burn SF, and Jackson IJ. 2006. ‘Regulation of pigmentation in zebrafish melanophores’, Pigment Cell Res, 19: 206–13. [DOI] [PubMed] [Google Scholar]
- Mione MC, and Trede NS. 2010. ‘The zebrafish as a model for cancer’, Disease Models & Mechanisms, 3: 517–23. [DOI] [PMC free article] [PubMed] [Google Scholar]
- Mort RL, Jackson IJ, and Patton EE. 2015. ‘The melanocyte lineage in development and disease’, Development, 142: 620–32. [DOI] [PMC free article] [PubMed] [Google Scholar]
- Mouti MA; Christopher D; Coupland SE; Hurlstone AFL 2016. ‘Minimal contribution of ERK1/2-MAPK signalling towards the maintenance of oncogenic GNAQQ209P-driven uveal melanomas in zebrafish’, Oncotarget: 1–17. [DOI] [PMC free article] [PubMed] [Google Scholar]
- Onken MD, Worley LA, Long MD, Duan S, Council ML, Bowcock AM, and Harbour JW. 2008. ‘Oncogenic mutations in GNAQ occur early in uveal melanoma’, Invest Ophthalmol Vis Sci, 49: 5230–4. [DOI] [PMC free article] [PubMed] [Google Scholar]
- Parichy DM, and Spiewak JE. 2015. ‘Origins of adult pigmentation: diversity in pigment stem cell lineages and implications for pattern evolution’, Pigment Cell Melanoma Res, 28: 31–50. [DOI] [PMC free article] [PubMed] [Google Scholar]
- Patton EE, Widlund HR, Kutok JL, Kopani KR, Amatruda JF, Murphey RD, Berghmans S, Mayhall EA, Traver D, Fletcher CD, Aster JC, Granter SR, Look AT, Lee C, Fisher DE, and Zon LI. 2005. ‘BRAF mutations are sufficient to promote nevi formation and cooperate with p53 in the genesis of melanoma’, Curr Biol, 15: 249–54. [DOI] [PubMed] [Google Scholar]
- Posch C, Latorre A, Crosby MB, Celli A, Latorre A, Vujic I, Sanlorenzo M, Green GA, Weier J, Zekhtser M, Ma J, Monico G, Char DH, Jusufbegovic D, Rappersberger K, Somoza A, and Ortiz-Urda S. 2015. ‘Detection of GNAQ mutations and reduction of cell viability in uveal melanoma cells with functionalized gold nanoparticles’, Biomed Microdevices, 17: 15. [DOI] [PMC free article] [PubMed] [Google Scholar]
- Rimoldi D; Salvi S; Lienard D; Lejeune FJ; Speiser D; Zografos L and Cerottini JC 2003. ‘Lack of BRAF Mutations in Uveal Melanoma’, Cancer Res, 63: 5712–15. [PubMed] [Google Scholar]
- Shoushtari AN, and Carvajal RD. 2014. ‘GNAQ and GNA11 mutations in uveal melanoma’, Melanoma Res, 24: 525–34. [DOI] [PubMed] [Google Scholar]
- ———. 2016. ‘Treatment of Uveal Melanoma’, Cancer Treat Res, 167: 281–93. [DOI] [PubMed] [Google Scholar]
- Singh AP, and Nusslein-Volhard C. 2015. ‘Zebrafish stripes as a model for vertebrate colour pattern formation’, Curr Biol, 25: R81–92. [DOI] [PubMed] [Google Scholar]
- Van Raamsdonk CD, Bezrookove V, Green G, Bauer J, Gaugler L, O’Brien JM, Simpson EM, Barsh GS, and Bastian BC. 2009. ‘Frequent somatic mutations of GNAQ in uveal melanoma and blue naevi’, Nature, 457: 599–602. [DOI] [PMC free article] [PubMed] [Google Scholar]
- Van Raamsdonk CD, Griewank KG, Crosby MB, Garrido MC, Vemula S, Wiesner T, C Obenauf A, Wackernagel W, Green G, Bouvier N, Sozen MM, Baimukanova G, Roy R, Heguy AD, Dolgalev I, Khanin R, Busam K, Speicher MR, O’Brien J, and Bastian BC. 2010. ‘Mutations in GNA11 in Uveal Melanoma’, The New England Journal of Medicine, 363: 2191–99. [DOI] [PMC free article] [PubMed] [Google Scholar]
- Wang D, Zhang Y, He Y, Li Y, Lund FE, and Shi G. 2014. ‘The deficiency of Galphaq leads to enhanced T-cell survival’, Immunol Cell Biol, 92: 781–90. [DOI] [PubMed] [Google Scholar]
- White R, Rose K, and Zon L. 2013. ‘Zebrafish cancer: the state of the art and the path forward’, Nat Rev Cancer, 13: 624–36. [DOI] [PMC free article] [PubMed] [Google Scholar]
- Wu X, Li J, Zhu M, Fletcher JA, and Hodi FS. 2012. ‘Protein kinase C inhibitor AEB071 targets ocular melanoma harboring GNAQ mutations via effects on the PKC/Erk1/2 and PKC/NF-kappaB pathways’, Mol Cancer Ther, 11: 1905–14. [DOI] [PMC free article] [PubMed] [Google Scholar]
- Yamanaka H Kondo S 2014. ‘In vitro analysis suggests that difference in cell movement during interaction can generate various pigment patterns in vivo’, PNAS, 111: 1867–72. [DOI] [PMC free article] [PubMed] [Google Scholar]
- Yoo JH, Shi DS, Grossmann AH, Sorensen LK, Tong Z, Mleynek TM, Rogers A, Zhu W, Richards JR, Winter JM, Zhu J, Dunn C, Bajji A, Shenderovich M, Mueller AL, Woodman SE, Harbour JW, Thomas KR, Odelberg SJ, Ostanin K, and Li DY. 2016. ‘ARF6 Is an Actionable Node that Orchestrates Oncogenic GNAQ Signaling in Uveal Melanoma’, Cancer Cell, 29: 889–904. [DOI] [PMC free article] [PubMed] [Google Scholar]
- Yu FX, Luo J, Mo JS, Liu G, Kim YC, Meng Z, Zhao L, Peyman G, Ouyang H, Jiang W, Zhao J, Chen X, Zhang L, Wang CY, Bastian BC, Zhang K, and Guan KL. 2014. ‘Mutant Gq/11 promote uveal melanoma tumorigenesis by activating YAP’, Cancer Cell, 25: 822–30. [DOI] [PMC free article] [PubMed] [Google Scholar]
Associated Data
This section collects any data citations, data availability statements, or supplementary materials included in this article.