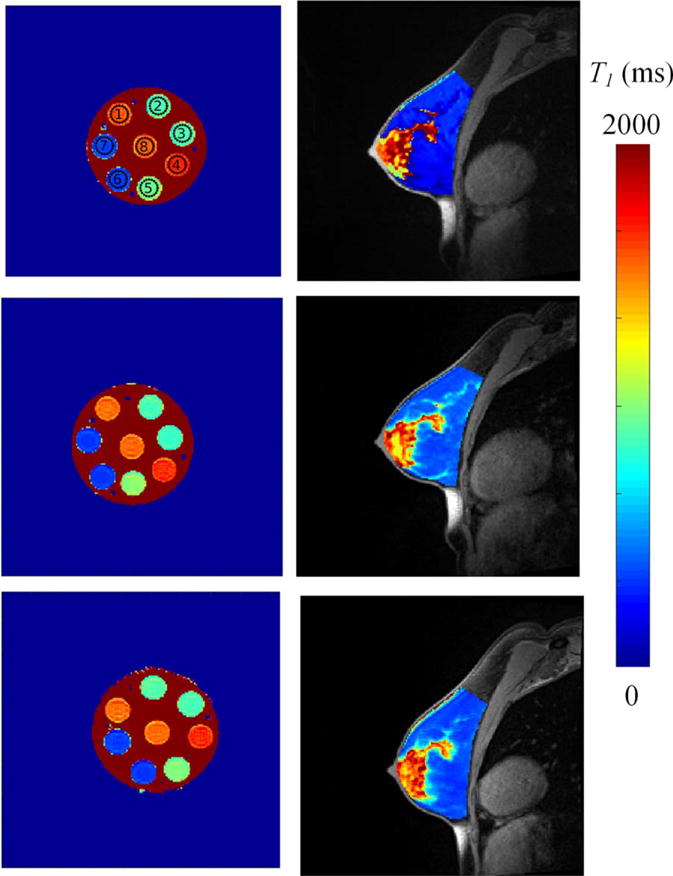
FIGURE 5.

Reproducibility of T1-mapping reveals less than 10% change across three community sites. Shown are the crosssectional images of T values overlaid on the high-resolution anatomical image of (a) phantom and (b) example normal subject B1-corrected T1 map from the three sites.
