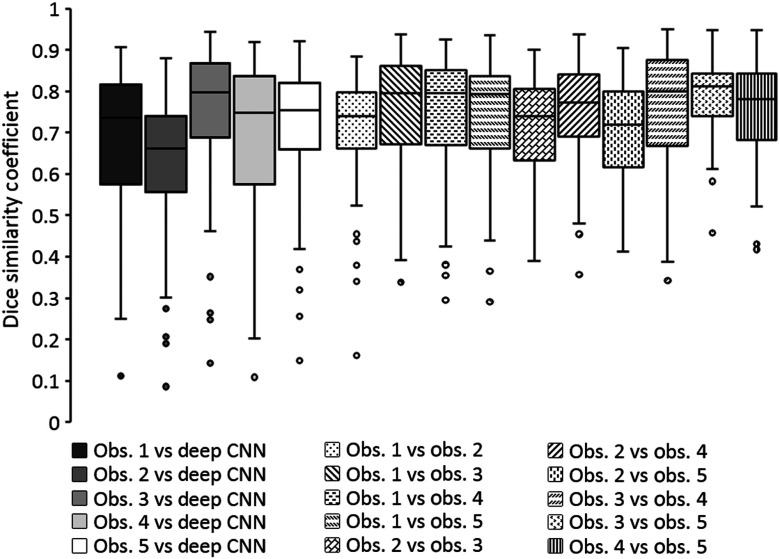
Fig. 5.
Boxplots showing the DSC values obtained when comparing the predicted tumor segmentations by the present deep CNN method with observer reference segmentations on test set 2 and when comparing reference segmentations across observers on test set 2. Horizontal lines inside the boxes indicate the median value of each distribution.

