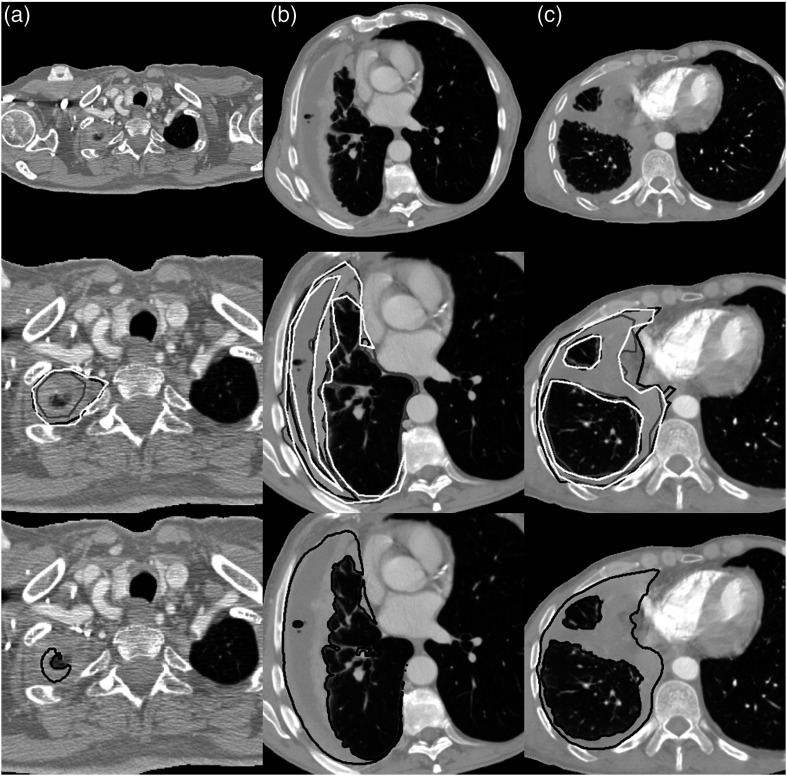
Fig. 7.
Preprocessed CT sections (top), observer reference tumor segmentations (middle; white, gray, and black outlines), and deep CNN-predicted tumor segmentations (bottom; black outlines), for three sections of the two test sets. Sections were selected at random from (a) the bottom 10th percentile (test set 1, average DSC = 0.366), (b) the interquartile range (test set 2, average DSC = 0.647), and (c) the top 10th percentile (test set 1, average DSC = 0.857) of the average DSC value when comparing deep CNN-predicted and observer reference segmentations across both test sets. In (b), only three of the five observer segmentations are shown in white, gray, and black outlines according to the lowest, highest, and median DSC value for this axial section, respectively.

