Figure 1.

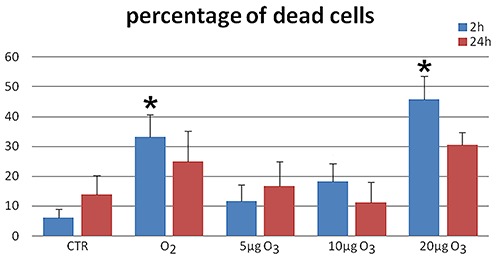
Mean values ± SE of dead cell percentage in the different samples 2 h (blue columns) and 24 h (red columns) after treatment. Asterisks indicate values significantly different from control at the same time point.

Mean values ± SE of dead cell percentage in the different samples 2 h (blue columns) and 24 h (red columns) after treatment. Asterisks indicate values significantly different from control at the same time point.